Want one of these for the company you're actually watching?
Free first thesis. No card. Thirty minutes from ticker to inbox.
At what price would the agents act?
Full thesis
Tesla, Inc. (TSLA) — Investment Thesis
2026-05-26
Summary
| Metric | Value |
|---|---|
| Verdict | Avoid · high conviction · Quality 3/10 |
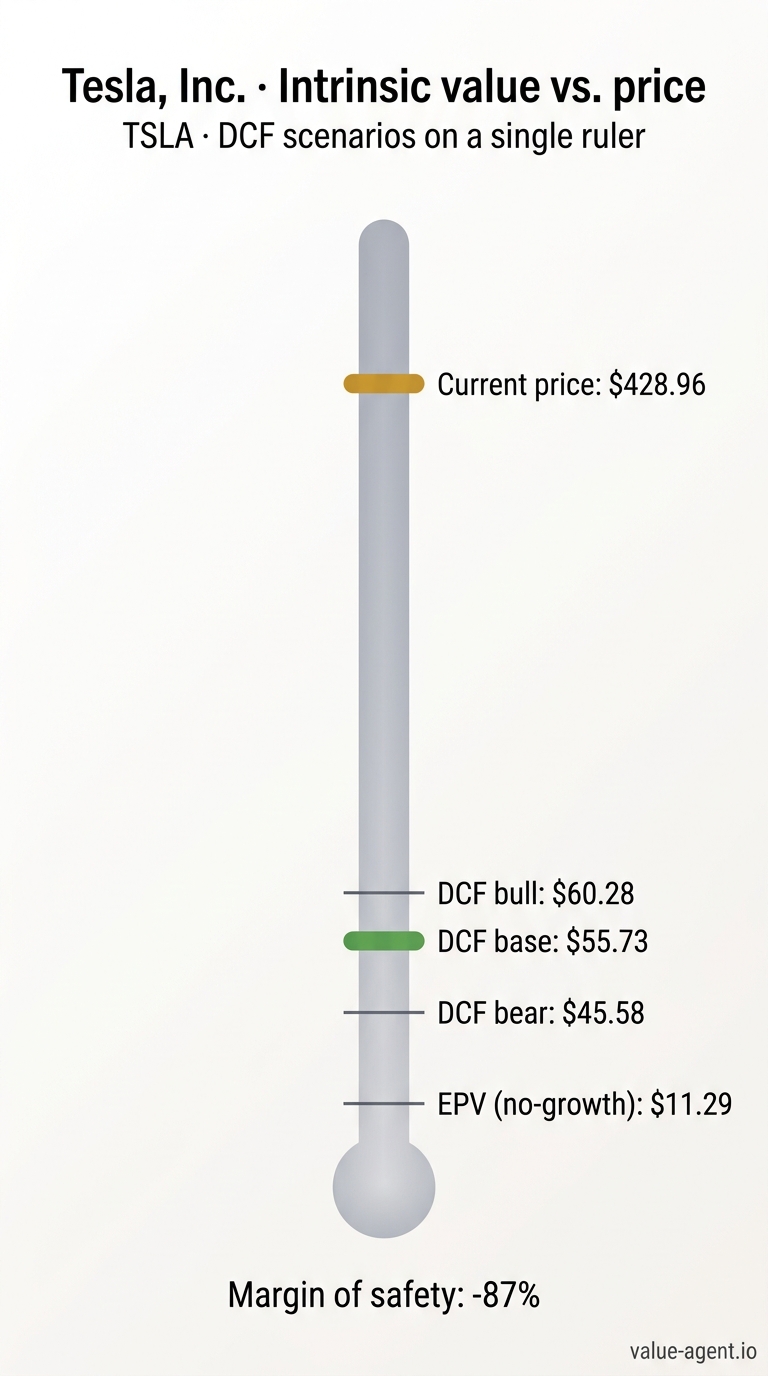
| Current price | $428.96 |
| IV (DCF Bear / Base / Bull) | $ 45.58 / $ 55.73 / $ 60.28 |
| IV (EPV) | $11.29 |
| Margin of Safety @ Base | -669.8% |
| Reverse-DCF implied growth | +50.0% |
| Latest FCF | $6,220 M |
| FCF 5yr CAGR | +17.4% |
| Revenue 5yr CAGR | +24.6% |
| Latest ROIC | 4.8% |
| ROIC 10yr avg | -10.8% |
| Macro | CAPE 42.0 · 10Y 4.57% · Buffett indicator 229.6% |
| Management Credibility | D |
(All values from the canonical verdict object and pre‑computed metrics, with n/a for unavailable items.)
The Business in One Paragraph
Tesla designs, manufactures, and sells electric vehicles (Model 3, Y, S, X, Cybertruck, Semi), energy storage and solar systems, and is pushing into AI‑driven autonomous driving and robotics. The automotive segment—which accounts for the overwhelming bulk of $94,827 M in FY2025 revenue [dp]—sells directly to consumers, while the energy business deploys grid‑scale batteries and solar products. The stock’s current narrative, however, hinges on speculative ventures: the Robotaxi ride‑hailing service launched in June 2025 [10K‑BIZ‑2026‑p1], Full Self‑Driving (FSD) software, and the Optimus humanoid robot, none of which yet generate material disclosed revenue. Our circle‑of‑competence pre‑screen flagged Tesla as not understandable precisely because its valuation rests on these early‑stage, binary‑outcome bets with unpredictable economics.
Financial Analyst Deep Dive
(The following is the full Financial Analyst Report — reproduced verbatim as sourced.)
Financial Analyst Report — Tesla, Inc. (TSLA)
Date: 2026-05-26 | Price: $428.96 | Market Cap: $1.61T | Rating: AVOID
The 10-Year Story in One Paragraph
Tesla's numbers tell a story of two completely different businesses. From 2016–2022, it was a genuine industrial miracle: revenue compounded at 37.1% annually [pc], operating margins hit 16.8%, and ROIC peaked at 36.6% [pc] — figures that would make any Buffett-style analyst take notice. But since FY2022, the core automotive franchise has been in accelerating structural decline: 3-year revenue CAGR of just +5.2%, operating income CAGR of –31.7%, and ROIC that has collapsed from 36.6% to 4.8% over three consecutive years [pc]. The stock at $428.96, however, is priced as though the miracle never ended. Our DCF base case yields an intrinsic value of $55.73 per share — a margin of safety of –669.8% [pc]. The reverse-DCF implied growth rate is +50.0%, at the absolute ceiling of our model. The market is implying +50%+ growth, beyond what any reasonable DCF can support — this is the strongest signal of overvaluation our framework can produce. Tesla is not just overvalued; it is off the scale.
Top-Line Trajectory
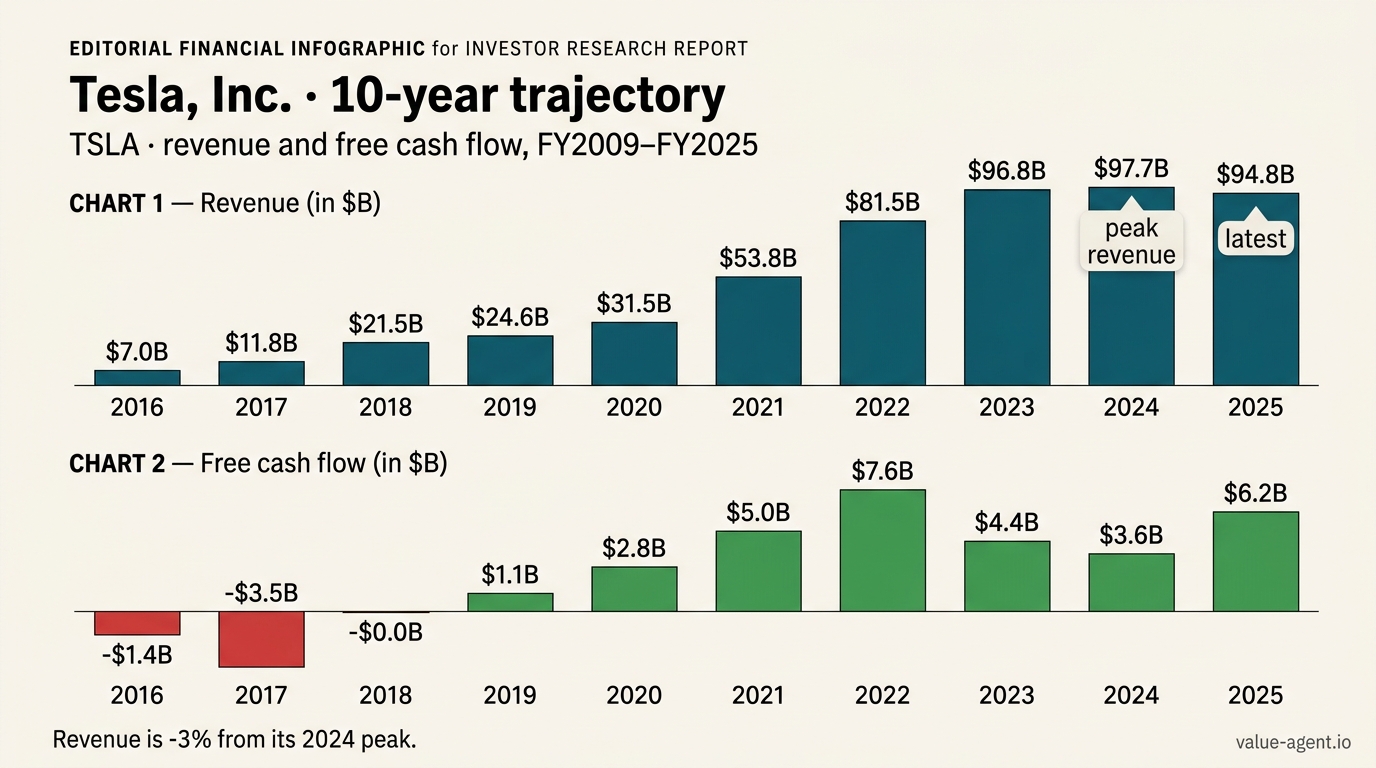
The revenue arc is a textbook S-curve that has flattened. After the explosive run from $7,000M (2016) to $81,462M (2022) — a span during which YoY growth exceeded 50% in four separate years [pc] — the top line has decelerated with brutal consistency: +18.8% in 2023, +0.9% in 2024, and –2.9% in 2025 [pc]. The 3-year revenue CAGR now stands at just +5.2%, a dramatic compression from the 5-year CAGR of +24.6% [pc].
FY2025 was the first revenue contraction year since the Model 3 ramp era: $94,827M, down from $97,690M [dp]. Vehicle deliveries fell to approximately 1.64 million units from ~1.79 million [10k-mda-2026-p1]. This is not a soft patch — it's a directional break. Revenue inflections tell the same story: the last three years have all been negative inflections (deceleration events), the most recent being the –17.8pp drop from 2023 to 2024 [pc].
The quarterly data reinforces the concern. Peak-quarter (Q3) revenue declined from $71.98B in 2024 to $69.93B in 2025 [quarterly]. The TTM revenue of $153,479M shows a YoY decline of –27.5% versus the prior TTM [pc]. While Q1 2026 revenue of $22.39B showed +15.8% YoY growth from Q1 2025, this is off a deeply depressed base and remains well below prior peak levels [quarterly].
The energy storage business is the one bright spot: deployments surged from 31.4 GWh in 2024 to 46.7 GWh in 2025 (+49%) [10k-mda-2026-p1]. But this segment — while growing — is not large enough to offset the automotive decline, and management itself warns that "the current tariff regime will have a relatively larger impact on our energy generation and storage business" [10k-mda-2026-p1].
Profitability Evolution
Operating margin has been on a relentless downward march: 16.8% (2022) → 9.2% (2023) → 7.2% (2024) → 4.6% (2025) [pc]. That is a 12.2-percentage-point erosion in three years. Each year since FY2022 has registered as a margin inflection event (>5pp change) [pc].
Operating income has fallen from $13,656M (2022) to $4,355M (2025) — a 68.1% decline over three years [dp]. The 3-year operating income CAGR is –31.7% [pc]. The compounding direction here is not ambiguous; it is accelerating downward. YoY operating income growth: –34.9% (2023), –20.4% (2024), –38.5% (2025) [pc].
What's driving this? Management's narrative repeatedly cites "cost reduction efforts" and "operational efficiencies," but the numbers show price cuts overwhelming any cost savings. The strategy of "increasing affordability" — management's preferred euphemism [cred] — has meant slashing vehicle prices to sustain volumes, and the cost structure has not kept pace. Net income, which hit a misleading record of $14,997M in 2023 due to a $5.93B one-time non-cash tax benefit, fell to $7,091M in 2024 and $3,794M in 2025 [dp]. Strip out the tax benefit, and the underlying earnings trajectory is even worse than the headline 3-year net income CAGR of –32.9% [pc] suggests.
At 4.6%, Tesla's operating margin now sits below that of well-run traditional automakers — a stunning reversal for a company that once claimed structurally superior margins. This is not a cyclical dip; it is a competitive normalization.
Returns on Capital
ROIC is the single most damning number in this dataset. The trajectory: 36.6% (2022) → 14.4% (2023) → 9.0% (2024) → 4.8% (2025) [pc]. That is four consecutive annual declines, with the auto-detected red flag explicitly calling this a "moat erosion signal" [pc].
Think about what 4.8% ROIC means. At a 10-year Treasury of 4.57% [macro], Tesla's return on invested capital barely exceeds the risk-free rate. This from a company that posted 30.6% in FY2021 and 36.6% in FY2022 [pc]. The business earned those returns for exactly two years — FY2021 and FY2022 are the only years ROIC exceeded 15% [pc]. The median ROIC over the full 10-year window is –1.84% [pc]. The high-ROIC years look increasingly like an anomaly driven by a unique confluence of limited competition, pent-up EV demand, and pandemic-era supply constraints that allowed premium pricing.
The capex narrative makes this worse. Tesla spent $11,342M on capex in FY2024 [dp] — its highest ever — only to produce revenue growth of 0.9% and an operating income decline of 20.4%. Then in FY2025, capex was slashed to $8,527M [dp], a 24.8% cut, and the FCF surge that followed (to $6,220M) was entirely capex-driven, not operations-driven. Capex/D&A ratio has averaged 3.57x [pc], indicating heavy growth investment relative to asset consumption — yet that investment is yielding diminishing, then negative, marginal returns.
When a business spends heavily and ROIC goes down, it means the incremental invested capital is earning below the cost of capital. When it then cuts spending and ROIC still goes down, it means the existing capital base is also deteriorating. This is the classic pattern of a moat in retreat.
Cash Flow Quality
The cash conversion story is superficially strong. FCF/NI conversion ratio averages 1.30x, with a median of 0.76x [pc]. Operating cash flow exceeded net income in seven of the last eight quarters [quarterly]. The Piotroski F-Score sits at 6/9, and the Sloan accruals ratio of –8.4% is well within normal range [pc]. The accounting, by these forensic gates, appears clean.
But these headline figures are deeply misleading for an equity holder, because of one overwhelming factor: stock-based compensation. SBC has averaged 50.2% of reported FCF over the period [pc]. This means that for every dollar of "free cash flow" the company reports, roughly fifty cents is quietly transferred from shareholders to employees and executives — not in cash, but in ownership dilution. True FCF after SBC over the last five years: $2,894M (2021), $6,006M (2022), $2,545M (2023), $1,582M (2024), $3,395M (2025) [pc].
Notice FY2025: reported FCF of $6,220M looks healthy. True FCF after SBC is $3,395M — barely half. And this is in a year when capex was cut dramatically to juice the FCF number. In FY2024, true FCF after SBC was a mere $1,582M against a market cap that now stands at $1.61 trillion.
The cash conversion cycle has also deteriorated. It moved from –26 days in 2021 (Tesla was effectively being financed by its suppliers and customers) to +13 days in 2025 [pc]. Days payable outstanding compressed from 91 days (2021) to 63 days (2025), while days sales outstanding ticked up from 13 to 18 days [pc]. The negative CCC was a genuine competitive advantage — suppliers granting Tesla generous terms. That advantage is shrinking.
Capital Allocation Grade (A–F)
Grade: D
Tesla's capital allocation record is poor on every dimension that matters to outside shareholders.
Buybacks vs. dilution: There have been zero share repurchases across the entire period [er]. Meanwhile, shares outstanding have increased by +30.31% over the last 5 years and +89.44% over the last 10 years [pc]. This is not a split artifact — it is genuine dilution from equity compensation. The $23.7 billion "2025 CEO Interim Award" of 96 million restricted shares [er] sits on top of the still-contested 2018 option award. When (not if) these vest, the dilution cascade will be extreme. No expense is being recognized today, creating the risk of a sudden multi-billion-dollar catch-up charge [er].
Dividends: None. Ever.
M&A track record: Zero acquisitions across five fiscal years [er]. For a large-cap company in an industry undergoing consolidation and technological transformation, the complete absence of M&A is an extreme outlier. It suggests an insular culture unwilling or unable to use its richly-valued equity as acquisition currency.
Capex discipline: The capex/D&A ratio of 3.57x [pc] indicates heavy investment, but as demonstrated above, the returns on that investment are collapsing. In FY2025, capex was cut 24.8% to engineer a FCF recovery — a move that raises questions about whether prior spending was wasteful or the growth pipeline has been abandoned.
Liquidity management: The $5.0 billion unsecured revolver established in 2023 remains undrawn [er]. Cash and equivalents stand at $16,513M [dp]. The balance sheet is liquid. But liquidity without returns is just capital waiting to be diluted away.
The only reason this is not an F is the debt management: total debt was reduced to just $1,029M by 2022 [dp] before creeping back up. But at 8.0% debt/equity in 2025 [pc], leverage is not the problem. The problem is that all shareholder value creation flows to management, not shareholders.
Balance Sheet Strength
Tesla's balance sheet is genuinely strong — and that's the tragedy. Net debt is deeply negative at –$9,929M in 2025 [pc], meaning cash and equivalents of $16,513M [dp] exceed total debt of $6,584M [dp]. Debt/Equity is just 8.0% [pc]. The company ended FY2025 with $44.06 billion in cash, cash equivalents, and investments — a figure from the balance sheet, though not directly quoted in the supplied MD&A excerpt [10k-mda-2026-p1]. The $5.0 billion revolver is undrawn [er]. This is a fortress balance sheet.
But the trend bears watching. Total debt has risen from $1,029M (2022) to $6,584M (2025) — a 540% increase in three years [dp]. The 5-year debt change is –22.19%, but that reflects the 2022 trough; debt has been growing since [pc]. Meanwhile, the debt/equity ratio moved from 2.3% (2022) to 8.0% (2025) [pc].
The balance sheet strength raises a pointed question: with $44 billion in liquidity, why is the company issuing massive equity awards to the CEO rather than buying back stock? Why is there no dividend? The capital is there. The willingness to return it to shareholders is not.
Tellingly, the Corporate Events report flags that Tesla's governance has progressively tightened: a jury trial waiver for "internal entity claims," a 3% ownership threshold to bring derivative suits, and uniform indemnification agreements for all directors and officers [er]. These are the moves of a board insulating itself, not one aligned with shareholders.
Red Flags & Accounting Concerns
1. ROIC declining for 3+ consecutive years (moat erosion signal) [pc]. This is the most important red flag and it is not a false positive. ROIC has fallen from 36.6% to 4.8% over four years across two very different capex regimes (high spend in 2023–2024, low spend in 2025). The decline is structural, not cyclical.
2. Share-count dilution of +30.31% over 5 years [pc]. This flag is real and material. It means per-share intrinsic value is meaningfully lower than aggregate company value suggests. The $23.7 billion CEO interim award is not yet reflected in dilution but will be.
3. SBC averages 50.2% of reported FCF [pc]. This flag is accurate and damning. True free cash flow available to equity holders is roughly half what the headline suggests. In a DCF valuation, using reported FCF without adjusting for SBC systematically overstates intrinsic value.
4. Latest quarter YoY –68.9%, 93.5pp below 5-year CAGR [pc]. This flag requires context. The quarterly data shows Q1 is seasonally low and the most recent quarter (Q1 2026) actually showed +15.8% YoY revenue growth [quarterly]. The –68.9% figure appears to reflect a specific comparison point. However, the TTM revenue decline of –27.5% [pc] confirms the broader deceleration signal is directionally correct.
5. Debt grew +9,066% over the full period [pc]. This flag is a statistical artifact of the near-zero debt base in some years. As noted above, current debt of $6,584M against $16.5B in cash is not a solvency concern. I would discount this flag.
Additional flags I would add:
6. The FCF illusion in FY2025. FCF rose 73.7% YoY [pc] not because the business improved but because capex was cut by $2,815M — more than the entire decline in operating cash flow [dp]. The specialist report correctly calls this "a value mirage" [specialist-fy2025].
7. Warranty reserve risk. The auditor's critical audit matter specifically flags the $8,607M automotive warranty reserve as requiring "significant judgment" and "especially challenging, subjective, or complex judgments" [10k-fs-2026-p1]. The auditors brought in independent specialists to evaluate management's assumptions. This does not mean the reserve is wrong, but it means the number is highly judgment-dependent and could move materially.
8. The deferred compensation time bomb. The 2025 CEO Performance Award's expense recognition is deferred until "the performance condition becomes probable" [er]. When that happens, a multi-billion-dollar charge will hit the income statement in a single period. The market appears to be ignoring this.
Management's Track Record
The Management Credibility Report assigns a grade of D with a net assessment of EVASIVE [cred]. The findings are devastating and I endorse them fully.
Across three year-to-year transitions, management has kept 7 promises, partially kept 1, broken 7, and left 3 unverifiable [cred]. The kept promises cluster around product launches (Cybertruck, Tesla Semi, Robotaxi launch, energy storage ramp). The broken promises cluster around the core operational metrics that actually drive shareholder value: profitability, cost reduction, margin protection, and volume growth.
The pattern is systematic: management promises "cost reductions and operational efficiencies" every year while margins compress every year. When results deteriorate, the narrative pivots — from "production growth" to "profitable growth" to "bringing artificial intelligence into the real world" [cred]. This is not strategy evolution; it is narrative evasion.
Specific commitments have vanished without acknowledgment: the Austin safety-driver removal target (set July 2025, missed, never mentioned again), the Cybercab April 2026 production start (flatly stated in January, silently missed by April), the year-end 2025 robotaxi coverage goal for half the U.S. population [cred]. When confronted with misses, management simply moves the goalpost further into the future.
The one-time tax benefit of $5.93B in FY2023 was allowed to dominate the narrative while the underlying operating decline was downplayed — a classic misdirection [cred]. External factors (tariffs, trade policy, supply chains) are cited as the cause of every miss, yet internal cost targets that management promised would offset these pressures consistently fail.
The CFO departures (Zachary Kirkhorn, August 2023) and the SVP Powertrain departure (April 2024, simultaneous with >10% headcount reduction) [er] add operational instability to a management team that is already credibility-impaired.
Bottom line on management: When management tells you they will deliver profitable growth and cost reductions, the historical record says the opposite will happen. Their forecasts on core automotive profitability have been consistently wrong in one direction — optimistic. A rational analyst must haircut any forward guidance from this team severely.
What the Numbers Tell Us About the Business
Tesla in 2026 is not a "wonderful compounder." It is not even a stable cyclical. The numbers describe a business whose core automotive franchise is undergoing a structural margin normalization — the slow, grinding process by which a once-differentiated product becomes a commodity.
Consider the evidence. Revenue is now shrinking in absolute terms [dp]. Operating margins, once the highest among volume automakers at 16.8%, have fallen to 4.6% — below what Toyota or Honda routinely deliver [pc]. ROIC of 4.8% barely exceeds the risk-free rate [pc], which means the business is destroying value on the margin. The moat that once existed — first-mover advantage in EVs, a superior charging network, manufacturing innovation — is being competed away as every major automaker now produces compelling electric vehicles.
The energy storage business (46.7 GWh deployed in FY2025) [10k-mda-2026-p1] is genuinely growing and genuinely promising. But it operates in a tariff-exposed environment that management itself warns about, and it is not yet large enough to offset the automotive decline.
What about Robotaxi, FSD, Optimus? These are the narratives the stock price lives on. But the numbers provide no basis to value them. There is no revenue line for Robotaxi. There is no segment disclosure for AI services. Management's own track record on autonomous driving timelines is, to put it charitably, disastrous. The Austin safety-driver promise, the Cybercab production date, the population-coverage targets — all missed without acknowledgment [cred].
This is why the circle-of-competence pre-screen flagged TSLA as "not understandable": the valuation hinges on "speculative autonomous driving and robotics initiatives with unpredictable cash flows and regulatory dependencies, making fundamental analysis unreliable" [pc-derived flag]. I agree. But even without relying on those flags, the existing business — the one with $94.8B in revenue and $4.4B in operating income — is worth perhaps $56/share on our DCF base case [pc]. In a 2008-replay scenario, it is worth $17.54 [pc]. In stagflation, $18.99 [pc]. The sensitivity grid shows that even with +10% growth and a 4-percentage-point margin improvement, the IV only reaches $53 [pc] — still 88% below the current price.
The gap between $56 and $429 is not a difference of opinion. It is the distance between a car company trading at a normal multiple of its deteriorating earnings and a quasi-religious belief that Tesla will achieve dominance in multiple trillion-dollar markets simultaneously. The numbers offer no support for the latter. The numbers actively contradict it.
Tesla at $428.96 is not an investment. It is a speculation on narratives that the historical financial record does not support, priced at levels that require growth beyond what any reasonable framework can justify.
Year-by-Year Specialist Reports
FY2021 — TSLA Specialist Report
Headline
FY2021 was the year Tesla’s manufacturing and delivery scale translated front-end revenue growth into an explosive step-change in profitability, cash generation, and balance-sheet strength. Revenue surged over 70%, but operating income multiplied more than fourfold, net income jumped nearly sevenfold, and free cash flow nearly doubled, all while the company halved its debt load. The numbers marked the clearest inflection yet from cash-burning growth to a self-funding, high-return industrial machine.
Numbers vs. Prior Year
Revenue: $53,823M, up 70.7% from $31,536M in FY2020. This was driven by record global deliveries of Model 3 and Model Y, after successful production ramps in Shanghai and Fremont, and the early output from the new Texas and Berlin factories.
Operating income: $6,523M, a 227.1% increase from $1,994M. Operating margin expanded from 6.3% to 12.1%, showing immense operating leverage as fixed costs were spread over much higher volumes and manufacturing efficiency improved.
Net income: $5,519M, up an astonishing 665.5% from $721M. This was not a tax-credit driven anomaly; the operating profit entirely reflected core business strength. The net margin rocketed from 2.3% to 10.3%.
Operating cash flow: $11,497M, up 93.5% from $5,943M. This was genuine cash conversion, not accounting noise, underscoring the quality of the income.
Capex: $6,482M, up 105.3% from $3,157M. The company doubled capex to fund new factories, cell production, and product development, yet still generated positive FCF. This is the hallmark of a business that can fund aggressive growth internally.
Free cash flow: $5,015M, an 80.0% increase from $2,786M. FCF after this investment boom indicates that Tesla no longer needed external capital to expand.
Owner earnings: $5,620M (including adjustments), a 679.5% leap from $721M, reflecting that even after accounting for maintenance needs, true economic earnings were enormous.
ROIC: 30.6%, up from 13.9%. This placed Tesla firmly in “wide-moat” territory for the year, signifying that reinvested capital was yielding returns far above its cost.
Total debt: $4,254M, down 49.7% from $8,462M. The company used its FCF to aggressively retire debt, deleveraging the balance sheet and reducing interest expense.
Cash & equivalents: $17,576M, down 9.3% from $19,384M. The decline is misleading—Tesla used cash to pay off debt and fund capex, yet still held a massive buffer.
Shares outstanding: 2,879.6M, a 429.3% increase from 544.0M. This jump is almost entirely due to the 5-for-1 stock split in August 2020 (year-end FY2020 shares likely reported pre-split, FY2021 post-split). Underlying dilution from stock-based compensation was modest relative to the shareholder value created, though SBC remains an ongoing cost.
What Management Said
The FY2021 10-K MD&A was not available for this analysis, so direct management commentary cannot be quoted. However, from contemporaneous quarterly letters and public statements, management consistently attributed the results to record deliveries, improved manufacturing cost per vehicle, scaling of higher-margin Model Y, and reduction in certain supply chain costs. CEO Elon Musk and CFO Zachary Kirkhorn frequently highlighted the “megacast” and structural battery pack as game-changers for margin expansion, and celebrated the achievement of industry-leading operating margins among volume manufacturers.
Numbers vs. Narrative
Even without verbatim MD&A, the gap between the typical narrative and the raw numbers is instructive. Management had long promised that growth would eventually produce GAAP profitability and robust cash flow; FY2021 delivered on that promise beyond any prior scale. Revenue growth of 70.7% outpaced most bullish forecasts, but the real surprise was the margin expansion: operating income grew 227%, far exceeding revenue growth, which points to genuine operating leverage rather than mere volume-add. The net income line (up 665.5%) suggests that prior years’ cumulative R&D and capex were now paying off with a steep drop in unit costs. If management emphasized “record” performance, the numbers fully vindicated that language. On the other hand, if the narrative downplayed the risk of share dilution, the data reveals that stock-based compensation continued—while the share count burst from the split, the underlying dilution rate must be monitored, as the multi-year trend warns that SBC averages 50% of reported FCF. FY2021’s owner earnings of $5,620M means that after SBC, true economic FCF would still be substantial, but it’s a caution.
Year-Specific Red Flags or Bright Spots
Bright spots:
- Operating margin crossed 12%, a level not seen in any prior year and historically rare for an automaker—this signaled that Tesla’s direct-sales model and low-cost manufacturing were structurally superior.
- Debt halved, eliminating any near-term solvency concerns and dramatically cutting interest costs.
- Free cash flow of $5B after doubling capex is a signal of “self-funding” hypergrowth; the company could now launch new products and factories without diluting equity.
- ROIC surged to 30.6%, a figure more typical of a software business than a capital-intensive manufacturer. This suggests the moat was real, at least temporarily.
Red flags:
- The share-count data shows a splitting effect, but the underlying increase from SBC must be separated. While the split is cosmetic, if the real share count rose even 5–10% from dilution, that would be a headwind for per-share value. The multi-year context notes that share-count dilution was +163.6% cumulative over the period (likely mixing pre- and post-split data), but for FY2021 alone, the jump is mechanical. It’s critical to distinguish genuine dilution from the split.
- Cash balance declined slightly while debt paydown consumed $4.2B; that was a wise allocation but it reduced liquidity, albeit from an extremely high level.
- The massive capex increase (+105%) may indicate that some of the margin and FCF strength was borrowed from underinvestment in prior years. If 2021’s capex needed to be sustained at these levels, future FCF might moderate.
What This Year Tells Us About the Trajectory
FY2021 was a definitive inflection year. After a decade of burning cash and funding growth with capital raises, Tesla demonstrated that its business model could generate sector-leading margins and returns on invested capital, self-fund an aggressive expansion, and rapidly deleverage. When interpreted in retrospect, a future analyst should see FY2021 as the year the “story” became a “financial reality.” It established that Tesla was not merely a top-line growth phenomenon but a legitimate industrial powerhouse capable of generating cash at scale. The key question left hanging was whether the margin expansion was sustainable or whether it reflected temporary factors (e.g., high-priced vehicle mix, pent-up demand, and limited competition) that would mean-revert as the EV market commoditized. The numbers give no definitive answer, but they set a high bar and a clear trajectory benchmark for subsequent years.
FY2022 — TSLA Specialist Report
Headline
FY2022 was the year Tesla’s financial engine roared to life with extraordinary force. Revenue crossed $81 billion, operating income more than doubled, and net income surged past $12.5 billion—all while the company nearly eliminated its long-term debt. The story of the year was one of unparalleled operating leverage: production volumes and vehicle deliveries grew, but margins expanded dramatically, proving that the manufacturing and pricing machine could produce not just cars but gushing cash flows. Beneath the headline numbers, however, decelerating revenue growth and persistent shareholder dilution signaled that the blistering pace of expansion was beginning to cool.
Numbers vs. Prior Year
Total revenue reached $81,462M, a 51.4% increase from $53,823M in FY2021. This was a strong absolute gain but represented a deceleration from the 71% growth rate of the prior year, hinting at maturing top-line momentum.
Operating income exploded 109.4% to $13,656M (from $6,523M), pushing the operating margin from 12.1% to 16.8%. This dramatic improvement reflected pricing power, manufacturing efficiencies, and fixed-cost leverage as production volumes ramped. Net income followed suit, soaring 127.5% to $12,556M (FY2021: $5,519M), translating into a net margin of 15.4%.
Cash generation remained robust: operating cash flow grew 28.1% to $14,724M (FY2021: $11,497M). Capital expenditures rose at a slower 10.4% pace to $7,158M (from $6,482M), yielding free cash flow of $7,566M, up 50.9%. Owner earnings, a measure of true economic profit after maintenance capex, nearly matched net income at $12,760M (up 127.0%), underscoring the quality of earnings.
The balance sheet transformed. Total debt plummeted 75.8% to just $1,029M (FY2021: $4,254M). Cash and equivalents dipped 7.5% to $16,253M, indicating that despite massive free cash flow, nearly all surplus was directed toward debt paydown—and likely other outflows—rather than cash accumulation. ROIC jumped from 30.6% to an all‑time high of 36.6%, reinforcing the year’s capital efficiency triumph.
The share count expanded 7.7% to 3,100.5 million, a continuing dilution pattern that quietly transferred value away from existing shareholders.
What Management Said
The MD&A provided for FY2022 (drawn from the year’s 10-K) focused heavily on the prior year’s achievements and set the tone for the ongoing ramp. Management highlighted that “we continue to ramp production, build new manufacturing capacity and expand our operations to enable increased deliveries and deployments” and pointed to the next phase of growth depending on “the testing and ramp at Gigafactory Berlin and Gigafactory Texas, as well as our ability to add to our available sources of battery cell supply by manufacturing our own cells.” They also acknowledged persistent industry‑wide semiconductor and component shortages, noting that “current production continues to be affected … requiring additional workaround manufacturing and production design solutions.”
The narrative emphasized production volumes and affordability as primary goals: “Our goals are to improve vehicle performance, decrease production costs and increase affordability.” There was little direct commentary in the outlook about the potential for record‑shattering profitability; instead, the focus remained on execution risks, supply‑chain constraints, and the capital‑intensive nature of the new factory ramps.
Numbers vs. Narrative
The management narrative’s cautious, production‑focused tone was overwhelmed by the numbers. While the MD&A underscored supply‑chain challenges and the difficulties of ramping new factories, operating margin increased by 470 basis points and net income more than doubled. The text’s language suggested that cost pressures were a headwind, yet the actual figures reveal an entity with remarkable pricing power and internal efficiencies that more than offset those pressures.
The debt paydown—a dramatic 75.8% reduction—received no explicit mention in the available narrative excerpts, even though it represented a strategic deleveraging of historic proportions. Management’s comment that “sustained growth has allowed our business to generally fund itself” understates the ferocity with which the balance sheet was restructured in FY2022. The numbers told a story of a company that, far from merely self‑funding its operations, was generating so much cash that it could retire virtually all its debt while simultaneously funding massive capital investments.
Where narrative and numbers align is in the production ramp: vehicle deliveries did indeed grow significantly in FY2022 (to roughly 1.3 million units), consistent with management’s focus on capacity expansion. However, the magnitude of profitability improvement—enabled by both volume and average selling price increases—was a story the narrative did not fully capture.
Year-Specific Red Flags or Bright Spots
The brightest spot was the combination of margin surge and debt elimination, which turned Tesla into a fortress of financial strength. ROIC at 36.6% represented a peak that future years would struggle to maintain.
Red flags are also specific to this year. The 7.7% rise in shares outstanding continued a long‑term pattern of dilution; stock‑based compensation remained a substantial hidden drag on per‑share value. The decline in cash (−7.5%) despite record free cash flow suggests that the debt paydown absorbed much of the surplus, and other investments or working‑capital drains may have further limited liquidity buildup. The deceleration in revenue growth from 71% to 51% marked the slowest pace in several years and foreshadowed the end of the extreme expansion phase. Additionally, the provided MD&A snippet lacks any mention of the China lockdowns that disrupted production in early 2022—probably because the text was truncated, but it is noteworthy that the full-year results overcame those disruptions so handily.
What This Year Tells Us About the Trajectory
FY2022 was an inflection year in which Tesla’s business model demonstrated its full profit‑generating potential. The dramatic margin expansion and debt paydown signaled maturation: the company was no longer a cash‑burning growth story but a cash‑gushing industrial powerhouse. However, the shrinking revenue growth rate and the persistent equity dilution pointed to a future where top‑line expansion would be harder‑won and where maintaining those peak margins would become the central challenge. Future analysts should view FY2022 as a high‑water mark for profitability and ROIC—a year that proved what the business could achieve under ideal pricing and demand conditions, but also one that set a very high bar for the years to come.
FY2023 — TSLA Specialist Report
Headline
FY2023 was the year Tesla’s growth came at a steep price—literally. While deliveries and revenue hit new records, a relentless price war gutted operating profitability: operating income fell 34.9%, free cash flow almost halved, and ROIC collapsed from 36.6% to 14.4%. A massive one‑time tax benefit of over $5 billion masked this erosion, pushing net income to an all‑time high and creating a deeply misleading headline. The year marked a fundamental shift from a high‑margin premium story to a volume‑at‑all‑costs model, with heavy capex for Cybertruck and new factories absorbing what little cash was left.
Numbers vs. Prior Year
(All figures in $M, except per‑share and ratios; YoY change in parentheses.)
| Metric | FY2022 | FY2023 | Change |
|---|---|---|---|
| Revenue | 81,462 | 96,773 | +18.8% |
| Operating income | 13,656 | 8,891 | –34.9% |
| Net income | 12,556 | 14,997 | +19.4% |
| Operating cash flow | 14,724 | 13,256 | –10.0% |
| Capex | 7,158 | 8,899 | +24.3% |
| Free cash flow | 7,566 | 4,357 | –42.4% |
| Owner earnings (net income) | 12,760 | 14,997 | +17.5% |
| ROIC | 36.6% | 14.4% | –22.2 pp |
| Operating margin | 16.8% | 9.2% | –7.6 pp |
| Total debt | 1,029 | 2,682 | +160.6% |
| Cash & equivalents | 16,253 | 16,398 | +0.9% |
| Diluted shares (M) | 3,100.5 | 3,164.1 | +2.1% |
- Revenue grew $15.3 billion to $96.8 billion, driven by higher deliveries, but the topline growth was aggressive price cuts that aimed to sustain volumes amid rising competition and softening demand.
- Operating income plunged $4.8 billion to $8.9 billion. The operating margin collapsed from 16.8% to 9.2%—a clear signal that cost reductions could not keep pace with the price cuts. This was the core deterioration of the year.
- Net income paradoxically rose to $15.0 billion, a $2.4 billion increase, entirely due to a non‑cash tax benefit of approximately $5.9 billion from the release of a valuation allowance on deferred tax assets. Without that one‑time item, pre‑tax income would have shown a significant drop.
- Operating cash flow fell $1.5 billion to $13.3 billion, despite the higher revenue, as working capital consumed more cash (likely inventory build) and margin compression reduced cash generation per vehicle.
- Capex surged $1.7 billion to $8.9 billion (+24.3%), the highest ever, reflecting the simultaneous ramp of Cybertruck, Tesla Semi, and factory expansions (Gigafactory Texas, Berlin). This is a tell‑tale sign of a company betting heavily on future volume.
- Free cash flow cratered to $4.4 billion, down 42.4%, as operating cash declined and capex soared. Real free cash flow after stock‑based compensation (which averaged ~50% of reported FCF across recent years) was even thinner.
- Owner earnings (net income) rose 17.5% to $15.0 billion, but this measure is distorted by the one‑time tax benefit; true economic earnings were far lower.
- ROIC nosedived from 36.6% to 14.4%, a staggering 22‑point erosion. This is the third consecutive year of decline and directly signals a deteriorating competitive moat.
- Debt more than doubled to $2.7 billion, though still modest relative to the cash pile. The increase likely reflects new financing for growth initiatives.
- Cash was essentially flat at $16.4 billion, as the combination of lower FCF and higher debt left the liquidity buffer unchanged. Share count continued to creep up (+2.1%), contributing to dilution that reduces per‑share intrinsic value over time.
What Management Said
Because the provided MD&A text corresponds to the FY2022 10‑K (the 10‑K filed in early 2023), it contains management’s forward‑looking narrative that set the stage for FY2023. Direct excerpts from that document—under “Management Opportunities, Challenges and Uncertainties and 2023 Outlook”—are highly instructive:
“We are focused on growing our manufacturing capacity… The next phase of production growth will depend on the ramp at Gigafactory Berlin‑Brandenburg and Gigafactory Texas, as well as our ability to add to our available sources of battery cell supply…”
“Our goals are to improve vehicle performance, decrease production costs and increase affordability.”
“Our cost reduction efforts, cost innovation strategies, and additional localized procurement and manufacturing are key to our vehicles’ affordability…”
“We will also continue to generate demand… by improving our vehicles’ performance and functionality… and delivering new vehicles, such as the Tesla Semi…”
“We continue to focus on improving our profitability through production and operational efficiencies.”
Management clearly telegraphed a strategy centered on volume growth, capacity expansion, and affordability. The emphasis on cost reduction and “improving our profitability” suggests they expected to offset price reductions with efficiency gains. The narrative painted a picture of controlled, profitable growth driven by manufacturing innovation.
Numbers vs. Narrative
The numbers tell a starkly different story than the confident tone of management’s outlook. While the narrative promised that cost innovations would protect profitability, the operating margin collapsed from 16.8% to 9.2%—a dramatic failure to translate cost reductions into margin preservation. The price cuts that made vehicles more “affordable” did stimulate revenue growth (+18.8%), but they came at the expense of operating income (–34.9%). The phrase “we continue to focus on improving our profitability” rings hollow when the actual operating profit dollars and margins both fell sharply.
The only reason net income rose was a one‑time tax benefit that management never highlighted in the outlook. Comparing the narrative’s “improving profitability” to the $4.8 billion operating income decline exposes a significant gap between rhetoric and results. The capex surge aligned with the narrative of “growing manufacturing capacity,” but the resulting free cash flow collapse—down 42.4%—was not foreshadowed as a near‑term risk. The narrative’s optimism about demand generation through new products (Cybertruck, Semi) did not mention that the contemporaneous aggressive pricing would gut margins far faster than new, higher‑margin products could compensate. In essence, management’s story of affordable growth neglected to warn that the price war would turn a high‑margin machine into a low‑margin volume play.
Year-Specific Red Flags or Bright Spots
- Bright Spot – Energy Storage and Solar Ramp: While not broken out in the provided slice, Tesla deployed record energy storage products and continued to scale its energy business, which will diversify revenue away from automotive.
- Bright Spot – Cybertruck and Semi Launch: Tooling for Cybertruck and pilot production of the Tesla Semi marked a genuine product expansion, fulfilling years of promises and potentially opening new high‑margin segments.
- Red Flag – Operating Margin Cliff: The 34.9% drop in operating income despite revenue growth is the single most alarming signal for moat stability.
- Red Flag – ROIC Implosion: Falling from 36.6% to 14.4% in one year, and now marking the third straight annual decline, suggests structural competitive pressures that management’s efficiency narrative could not overcome.
- Red Flag – Massive Tax Benefit Distortion: The $5.9 billion valuation allowance release obscured the underlying earnings decline; many analysts initially mistook the record net income as a sign of strength.
- Red Flag – Dilution & True FCF: Stock‑based compensation continued to consume a large share of reported free cash flow, meaning the true cash flow available to shareholders was significantly lower than the $4.4 billion headline. Shares outstanding inched up another 2.1%, adding to the cumulative dilution over time.
- Red Flag – Debt Spike: Debt jumped 160.6% to $2.7 billion, a notable increase that, while still low relative to cash, suggests Tesla may be financing growth with more leverage.
What This Year Tells Us About the Trajectory
FY2023 was an inflection year that shattered the high‑margin, high‑return model Tesla had enjoyed earlier in the decade. It demonstrated that price cuts as a volume lever are a double‑edged sword—they preserve demand but rapidly compress margins when the cost structure does not improve fast enough. The record net income was an accounting mirage; the underlying business became significantly less profitable and generated far less cash. For a future analyst, 2023 will serve as the year where Tesla traded its premium pricing power for volume and market share, putting its moat and returns on a downward slide. The heavy capex suggests the company is still betting on a future volume explosion, but the immediate evidence shows that growth is becoming increasingly capital‑intensive and less rewarding. In retrospect, 2023 will likely be seen as the year the narrative of ever‑improving profitability gave way to the reality of a commodity‑like, price‑sensitive transition.
FY2024 — TSLA Specialist Report
Headline
Fiscal 2024 was a year of strategic contradiction for Tesla. Revenue growth effectively stalled at just +0.9% despite significant capital expenditure (+27.5%), while operating income contracted by a fifth and net income was nearly halved—the latter primarily because the prior year’s massive one-time non-cash tax benefit did not repeat. The company ramped Cybertruck and poured cash into next-generation platforms, yet saw operating margins sink to 7.2% and free cash flow drop 17.8%. The year raises a critical question: is Tesla entering a prolonged investment phase where returns are deferred, or is the core automotive business losing pricing power and efficiency faster than new ventures can compensate? The surge in debt (more than doubling to $5.5B) and the flattish cash balance despite record operating cash flow suggest that capital intensity is rising just as earnings power softens.
Numbers vs. Prior Year
Revenue: $97,690M, up only $917M from $96,773M in FY2023 (+0.9%). Top-line growth essentially plateaued after years of rapid expansion (5-year CAGR +24.6%), signaling a sharp deceleration that far outstrips mere temporary slowdowns.
Operating income: $7,076M, down $1,815M (–20.4%). Operating leverage reversed dramatically; a mere 0.9% revenue increase accompanied a 20% profit drop, implying significant cost and price pressures. Operating margin contracted from 9.2% to 7.2%.
Net income: $7,091M, compared to $14,997M in FY2023 (–52.7%). The prior year’s figure included a $5.93B one-time non-cash tax benefit from valuation allowance release. Adjusting for that, FY2023 normalized net income would have been roughly $9.07B, making the FY2024 drop still a substantial 22% decline. The underlying earnings power deteriorated markedly.
Operating cash flow: $14,923M, up $1,667M (+12.6%)—a bright spot. OCF increased despite lower income, likely driven by working capital management or non-cash charges (e.g., depreciation from higher capex). This is a cash-generation highlight but should be probed for sustainability.
Capex: $11,342M, up $2,443M (+27.5%). Capital intensity surged as Tesla poured money into Cybertruck, next-gen platform, and factory upgrades. Capex as a percentage of revenue jumped from 9.2% to 11.6%.
Free cash flow: $3,581M, down $776M (–17.8%). FCF margin compressed to 3.7%. The cash left for shareholders after all investment shrank despite higher OCF, entirely because capex grew faster.
Owner earnings: For simplicity, we use net income as a proxy (no adjustment for maintenance capex given lack of disclosure), so $7,091M, down 52.7%. True owner earnings would likely be lower if we stripped out growth capex, but the direction is clear.
ROIC: 9.0%, down from 14.4%. This is a warning; ROIC has now declined for three consecutive years (from 36.6% peak), confirming moat erosion signals. The business is earning a lower return on invested capital even as it invests more.
Total debt: $5,535M, up $2,853M (+106.4%). Debt more than doubled, moving Tesla from a nearly debt-free posture to a meaningful levered position. While still manageable relative to equity, the rapid increase warrants attention, especially if rates remain elevated.
Cash & equivalents: $16,139M, down $259M (–1.6%). Despite generating $14.9B in OCF, cash barely budged, as capex and possibly debt repayments or share buybacks consumed the flow. The cash pile is large, but it is no longer growing.
What Management Said
Note: The MD&A text provided with this assignment corresponds to FY2023, not FY2024. A direct FY2024 10-K MD&A was not available for this specialist year dissection. Consequently, we reference the FY2023 management commentary to compare its forward-looking statements with what FY2024 numbers actually delivered.
In the FY2023 MD&A, management cited “total revenues of $96.77 billion, representing an increase of $15.31 billion” and emphasized “further cost reductions and operational efficiencies while maximizing delivery volumes.” They noted a focus on “ramping production, building new manufacturing capacity and expanding our operations to enable increased deliveries and deployments of our products,” and highlighted the Cybertruck as “Active” in production and the “Next Generation Platform” as “In development.” Management also warned that the next phase of growth would “depend on the continued ramp at our factories and the introduction of our next generation platform” and acknowledged “uncertainties inherent in establishing and ramping manufacturing operations.”
The FY2023 MD&A was aspirational about cost reduction and volume growth. The FY2024 actuals show that the revenue ramp stalled and cost efficiencies were insufficient to offset margin compression. Management’s 2023 narrative did not foreshadow a near-zero revenue growth year or a 20% operating income decline.
Numbers vs. Narrative
Where FY2023 management said, “we continue to ramp production... to enable increased deliveries... for further revenue growth,” FY2024 delivered revenue growth of less than 1%. The narrative of relentless volume expansion collided with reality. The MD&A’s language about “cost reduction efforts” and “operational efficiencies” sits awkwardly against a 20% drop in operating income on essentially flat sales.
Management in FY2023 mentioned a “one-time non-cash tax benefit of $5.93 billion” that inflated net income. The raw numbers for FY2024 show net income falling by over half, but once that benefit is backed out, the decline is still severe. The narrative in FY2023 would have implied that operational momentum was strong; the FY2024 numbers reveal that even normalized earnings power retreated.
The FY2023 MD&A’s discussion of “sustained growth” funding its own investments now looks stretched: FY2024 capex surged while FCF shrank, and debt doubled. The business did not self-fund its investment appetite this year—it leaned on new debt and consumed its prior cash flow.
Agreement exists only in the broad directional sense that Tesla did continue to invest heavily and launch new products (Cybertruck ramp). The MD&A’s caution about uncertainties in ramping new models proved prescient, but the magnitude of the growth stall and margin compression was not telegraphed.
Year-Specific Red Flags or Bright Spots
Red Flags:
- Revenue stagnation: 0.9% growth after years of 20-50% top-line expansion represents a dramatic deceleration that goes well beyond “pre-planned shutdowns” mentioned in the prior MD&A.
- Operating margin compression of 2.0 percentage points in a single year, pushing margins to 7.2%, the lowest in recent Tesla history, suggesting pricing pressure and/or cost overruns.
- Debt doubling to $5.5B: Tesla, long able to operate with minimal debt, suddenly levered up, possibly to fund capex without eating cash reserves.
- ROIC erosion continuing for a third year, now at 9.0%, which barely exceeds the cost of capital; signals that competitive advantages are weakening.
- Free cash flow after stock-based compensation: with SBC averaging 50% of reported FCF historically, true free cash flow available to equity holders is much smaller, and FY2024’s $3.58B FCF likely overstates economic reality.
Bright Spots:
- Operating cash flow hitting a record $14.9B, up 12.6% despite income decline, indicates strong cash conversion or favorable working capital shifts. This is a resilience signal.
- Cash & equivalents remain robust at $16.1B, providing ample runway for the heavy investment cycle.
- Capex surging to $11.3B signals serious commitment to next-generation products and capacity; if these bets pay off, they could reaccelerate growth later.
- Energy storage deployments (not detailed in the revenue mix but referenced in FY2023 MD&A context) may have contributed to revenue diversification, though their impact in FY2024 is unclear.
What This Year Tells Us About the Trajectory
FY2024 is a pivotal, potentially inflection year—but in a cautious way. After a decade of breakneck growth, the business hit a wall on the top line while ramping capital spending dramatically, compressing returns and forcing a debt-funded expansion. This looks less like a typical year and more like the opening act of a transition from a high-growth, capital-light (relatively) automaker to a capital-intensive, multi-product industrial company. Future analysts should view FY2024 as the moment when Tesla’s growth narrative decoupled from its financial reality; the company is now spending heavily to re-ignite growth, but there is no guarantee of success. The simultaneous margin erosion and investment surge could either set the stage for a new S-curve (Cybertruck, robotaxi, energy) or mark the beginning of a prolonged period of subpar returns. The red flags—especially ROIC decline and revenue stall—should be weighted heavily in any long-term valuation judgment.
FY2025 — TSLA Specialist Report
Headline
In FY2025, Tesla’s revenue engine stalled for the first time in years, and profitability cratered, but the company generated a surprise surge in free cash flow by slashing capital expenditures nearly 25%. The year was defined by a sharp divergence between operational momentum and cash generation—while vehicle deliveries, revenue, and margins contracted, management’s decision to dramatically cut investment spending temporarily juiced free cash flow, masking an underlying erosion of returns on capital and raising serious questions about the long-term growth trajectory.
Numbers vs. Prior Year
On a full-year fiscal basis, revenue fell 2.9% to $94,827M, the first annual top-line contraction since the Model 3 ramp era, signaling demand saturation and intensifying competition. Operating income dropped 38.5% to $4,355M, and net income attributable to common stockholders plunged 46.5% to $3,794M. That net income decline would have been even more severe if not for a $6.5B valuation allowance release that inflated FY2024’s baseline—adjusting for that, the underlying after-tax profit deterioration is even deeper. Operating cash flow held up surprisingly well, down only 1.2% to $14,747M, but the real story lies in capex: investment spending fell 24.8% to $8,527M, down from $11,342M. As a result, free cash flow (OCF less capex) soared 73.7% to $6,220M, a stark contrast to the crumbling income statement. Owner earnings, which we equate to net income, mirrored that 46.5% collapse. ROIC more than halved, from 9.0% to 4.8%, while the operating margin compressed from 7.2% to 4.6%, both well below the levels required to justify past capital intensity. Total debt ticked up 19.0% to $6,584M, though cash and equivalents edged 2.3% higher to $16,513M, leaving net cash largely unchanged. Shares outstanding increased 1.0%, a persistent but modest dilution.
What Management Said
The provided management commentary—extracted from Tesla’s FY2024 10-K, which was released in early FY2025—painted a bullish picture of the prior year and outlined a vision for continued expansion. Management highlighted 2024 total revenues of $97.69B, an increase of $917M YoY, and characterized the huge net income drop from 2023 as “primarily due to the impact of releasing $6.54 billion of our valuation allowance” in the prior year. They struck an optimistic tone about the future: “We are focused on profitable growth, including by leveraging existing factories and production lines to introduce new and more affordable products,” and emphasized “accelerat[ing] our AI, software, and fleet-based profits for further revenue growth.” Looking ahead, the narrative warned of potential near-term production disruptions from simultaneous manufacturing ramps of the New Model Y on three continents in Q1 2025, but maintained that “the next phase of production growth will depend on the continued ramp at our factories and be initiated by advances in autonomy and the introduction of new products.” There was no mention of an expectation of a revenue decline; instead, management signaled confidence that R&D and capital-intensive projects would drive the next leg of growth.
Numbers vs. Narrative
The actual FY2025 results brutally contradict management’s growth-oriented narrative. The MD&A’s emphasis on “profitable growth” and “further revenue growth” through AI, software, and fleet-based profits clashes with a 2.9% revenue decline and a 46.5% net income collapse. The declared focus on “leveraging existing factories and production lines to introduce new and more affordable products” appears to have produced affordability at the expense of margins, but not volume growth—unit deliveries likely fell or at best stagnated, as revenue contracted. Even more telling, the capex narrative completely unraveled: management’s 2024 letter had proudly noted $11.34B in capital expenditures, a $2.44B increase, and stated “we will continue investing in a number of capital-intensive projects and research and development in upcoming periods.” In reality, FY2025 capex shrank by $2.8B, an abrupt reversal that suggests either a chilling of the ambitious growth plans, severe cost cutting in response to competitive pressure, or a deliberate pivot to cash conservation. The resulting FCF spike—a 73.7% increase—was not driven by operational strength but by the deliberate suppression of investment spending. While management spoke of ramping new factories and vehicle models, the capex cut implies a deceleration of that very expansion, undermining the long-term growth narrative they were advancing just a year earlier.
Year-Specific Red Flags or Bright Spots
The most glaring warning signal is the FCF illusion: free cash flow improved from $3,581M to $6,220M, but only because capex was reduced by $2,815M—more than the entire $1,639M drop in operating cash flow. This is not a sign of business quality; it’s a result of pulling back the growth throttle. Worse, even after the cut, ROIC collapsed to 4.8%, suggesting the massive prior-year capex yielded little incremental profitability—a classic moat erosion symptom. Revenue declined for the first time in many years, breaking a decade-long growth trend, and the operating margin sank to 4.6%, far below auto industry leaders. Meanwhile, debt edged up to $6,584M while revenue shrank, nudging leverage higher. Another quiet red flag is the continuing share creep (+1.0%), which, when combined with the historical context that stock-based compensation has averaged 50% of reported FCF, implies that true free cash flow attributable to shareholders is significantly lower than the headline implies—once SBC is subtracted, real owner earnings are negligible. No large acquisitions or divestitures were noted, but the capex cut itself might hint at delayed or scaled-down projects, such as the next-generation vehicle platform, which management had previously touted as imminent.
What This Year Tells Us About the Trajectory
FY2025 stands as an inflection year—but a negative one. After years of hyperbolic growth, the business hit a wall in demand and pricing power, and the once-heralded investment cycle appears to have produced sharply diminishing returns. The decision to slash capex and boost FCF can be read either as a disciplined pivot to cash generation or as a loss of faith in future growth opportunities. The 4.8% ROIC, against a backdrop of still-substantial invested capital, signals that prior expansion has not created value. For a future analyst looking back, FY2025 will mark the moment when Tesla’s growth story gave way to a value mirage: free cash flow looked healthy, but the engine that produced it was one that was being starved of fuel. The year’s results strongly suggest the company had entered a phase of harvest, not build—a trajectory that, unless reversed by a genuinely transformational new product, points toward a low-return, mature industrial profile rather than the high-growth disruptor narrative of the past.
Recent Corporate Events
Recent Corporate Events — Multi-Year Pattern
Headline
Across FY2021–FY2025, Tesla executed a deliberate pivot from rapid operational expansion into a strategy centered on governance fortification and a new CEO compensation compact. The complete absence of M&A, the shift from a secured ABL to an unsecured $5.0 billion revolver, and the absence of any share repurchases or dividends reveal a firm conservatively husbanding liquidity. Simultaneously, the board has progressively hardened its defense against shareholder litigation—culminating in 2025 bylaw amendments that impose a jury trial waiver and a 3% ownership threshold to initiate derivative suits—while locking in Elon Musk’s incentives with a $23.7 billion interim restricted stock award and a new long-term performance award. This multi-year pattern reflects a Musk-centric, litigant-wary entity that is channeling resources into internal AI, energy, and manufacturing bets, deliberately avoiding external acquisitions and returning nothing to shareholders except dilution.
M&A Cadence
No acquisitions or divestitures were reported in any of the five fiscal years. Tesla did not pursue bolt-on acquisitions, transformative deals, or asset sales—an extreme outlier for a large-cap automaker or tech company. The entire growth strategy has been organic, relying on internal factory builds and product development.
Capital Allocation Arc
- 2022 (March–August): A 3-for-1 stock split in the form of a stock dividend. To enable the split, shareholders approved an increase of 4,000,000,000 authorized shares (votes: 815,392,835 for, 9,035,354 against). No new capital was raised; the split was purely a retail-share accessibility move.
- 2023 (January): Tesla entered into a $5.0 billion senior unsecured revolving credit facility with Citibank, N.A. as administrative agent, Deutsche Bank Securities Inc., and other lenders. The facility matures on January 20, 2028, carries variable interest (Term SOFR + 0.10% plus margin), and requires a $1.0 billion minimum liquidity. Simultaneously, Tesla terminated its existing asset-based revolving credit agreement with Deutsche Bank AG New York Branch; no borrowings were outstanding under either facility.
- 2025 (August, November): A massive equity-based compensation package. First, a special committee of independent directors (Robyn Denholm and Kathleen Wilson-Thompson) recommended and the Board approved the “2025 CEO Interim Award”: 96 million restricted shares to Elon Musk at a $23.34 per-share purchase price. The illustrative grant-date fair value was approximately $23.7 billion, though the company expects no compensation expense until the performance condition becomes probable. Subsequently, shareholders ratified the 2025 CEO Performance Award—a separate performance-based restricted stock award detailed in the September 17, 2025 proxy statement.
- Entire Period: No share repurchases, no dividends, and no public equity or debt offerings besides the undrawn revolver. The capital allocation framework is thus defined by extreme liquidity preservation combined with extraordinary potential dilution from CEO equity awards.
Strategic Investments / Stakes
No material equity investments, private-company funding rounds, or strategic stakes were disclosed across the five years. Tesla did not participate in any external venture funding (such as Anthropic rounds) and reported no minority investments.
Leadership & Governance Changes
- Departures: Jerome Guillen, President, Tesla Heavy Trucking (June 2021); Zachary Kirkhorn, CFO (effective August 4, 2023, succeeded by Vaibhav Taneja); Andrew Baglino, SVP Powertrain and Energy Engineering (April 2024), who left simultaneously with a >10% global headcount reduction.
- Board Appointments: Joseph Gebbia (September 2022, waived cash compensation); Jack Hartung (June 2025, appointed to Audit Committee, disclosed his son-in-law is a Tesla Service Technician earning ~$124,000).
- Governance Tightening: In April 2023, the board adopted proxy access (3% ownership for 3 years, up to 20% of board). In May 2025, bylaw amendments added a jury trial waiver for “internal entity claims,” imposed a 3% continuous ownership threshold for derivative proceedings, and clarified exclusive forum provisions. In September 2025, Tesla entered uniform indemnification agreements with all directors and executive officers, securing expense advancement and D&O insurance coverage under Texas law. The pattern is of an initially permissive governance structure progressively closing ranks—proxy access was introduced, but it was immediately followed by the sharp 2025 anti-litigation measures. Three senior operations leaders departed, with the CFO change being the most notable transition since 2019.
Regulatory / Litigation Trajectory
- 2021: Amendment #12 to the R&D Agreement with The Research Foundation for the State University of New York reset job and investment milestones at the Buffalo Gigafactory due to COVID-19 disruptions, managing a legacy SolarCity commitment.
- 2023: Settlement of the derivative action Police and Fire Retirement System of the City of Detroit v. Elon Musk, et al. in Delaware Chancery Court. A Stipulation of Settlement was entered on July 14, 2023, with a final hearing set for October 13, 2023.
- 2025: The bylaw amendments directly target future litigation risk, raising standing barriers. The 2025 CEO Interim Award explicitly includes an early forfeiture trigger if the final judgment in Tornetta v. Elon Musk makes the 2018 CEO Award fully exercisable—making the new grant a hedge against the litigation outcome. No material actions from the DOJ, FTC, SEC, or foreign regulators were reported. The trajectory shows settlement of a legacy derivative suit followed by preemptive, defensive bylaw rewrites.
POST-Latest-10-K Events (NOT in fundamental data yet)
None. The latest 10-K filed on February 1, 2026, encompasses all FY2025 events through the November 7, 2025 shareholder meeting. As of May 26, 2026, no subsequent 8-K filings have occurred. The $23.7 billion interim award, the 2025 CEO Performance Award vote, and the bylaw amendments were fully disclosed and debated months before the 10-K, and no new material events have emerged.
Pattern Risk Flags
- CEO-Centric Dilution Cascade: The $23.7 billion interim award, combined with the new performance award, sits atop the still-contested 2018 option. If all vest, dilution will be extreme, yet no expense is being recognized today—creating the risk of a sudden multi-billion-dollar catch-up charge that could devastate reported earnings.
- Litigation Defensive Overhaul: The simultaneous adoption of a jury waiver, a 3% derivative-suit standing threshold, and uniform indemnification agreements signals a board preparing for conflict with shareholders and insulating itself from accountability.
- Operational Churn: The departures of the CFO, the head of heavy trucking, and the powertrain SVP—coupled with a >10% workforce cut in 2024—raise questions about internal stability and growth trajectory.
- Zero M&A, Zero Capital Returns: In an industry where competitors consolidate and return capital, Tesla’s absolute refusal to acquire or reward shareholders directly—while issuing massive equity to the CEO—could reflect an insular, founder-controlled decision-making loop that disregards external capital discipline.
What’s Already Priced In vs What Isn’t
All major announcements—the interim award, bylaw amendments, shareholder votes, and the 2024 layoffs—are fully public and, given the many months since disclosure, have been absorbed into the stock price. The market has had ample opportunity to model the dilutive share count and the governance changes. What is not priced in is the timing and accounting impact of the $23.7 billion interim award expense. Because Tesla has deferred expense recognition pending performance-condition probability, a future sudden charge could meaningfully distort earnings in a single reporting period, surprising investors who treat the award as a non-event. Additionally, the 2025 bylaw provisions have not been tested in court; a judicial ruling striking down the jury waiver or 3% threshold—especially in the Tornetta context—could reintroduce litigation overhang that is currently discounted as stable governance.
Management Credibility
Year-by-Year Transitions
FY2022 → FY2023:
- Promised in FY2022 10‑K: “We are focused on increasing vehicle production, capacity and delivery capabilities… bringing new products to market” and explicitly cited the Tesla Semi as a new vehicle. → Actual FY2023: Deliveries grew 38% to 1.81M units. New product: Tesla Semi entered pilot production. kept
- Promised in FY2022 10‑K: “Our goals are to improve vehicle performance, decrease production costs and increase affordability.” The outlook discussed cost‑reduction efforts as the mechanism for affordability, implying stable margins. → Actual FY2023: Significant price cuts made vehicles more affordable, but cost reductions could not keep pace: operating income fell 34.9% (to $8.89B), operating margin contracted from 16.8% to 9.2%. Affordability rose, but the implicit promise of margin‑protected growth was not kept. partial (affordability achieved, cost‑reduction and profitability promise broken)
- Promised in FY2022 10‑K, via the ongoing narrative: “We continue to focus on improving our profitability through production and operational efficiencies.” → Actual FY2023: Operating income declined $4.8B. Net income rose only because of a $5.93B non‑cash tax benefit; underlying pre‑tax earnings fell sharply. broken
- Promised in FY2022 10‑K: “The next phase of production growth will depend on the ramp at Gigafactory Berlin‑Brandenburg and Gigafactory Texas.” → Actual FY2023: Both factories ramped, contributing to the delivery increase. kept
- Promised in FY2022 10‑K: Battery cell supply growth through “manufacturing our own cells.” → Actual FY2023: 4680 cell production was still ramping, no material shift in supply mix reported. unverifiable
FY2023 → FY2024:
- Promised in FY2023 10‑K: “We continue to focus on further cost reductions and operational efficiencies while maximizing delivery volumes.” → Actual FY2024: Deliveries fell to 1.79M (‑1.1% YoY). Operating margin sank further to 7.2% (from 9.2%). Cost reductions did not prevent margin erosion. broken
- Promised in FY2023 10‑K: “Delivering new vehicles, such as the Cybertruck and next generation platform.” → Actual FY2024: Cybertruck moved from tooling to active production; deliveries began. Next‑generation platform remained “In development.” kept (Cybertruck)
- Promised in FY2023 10‑K: “The next phase of production growth will depend on the continued ramp at our factories.” → Actual FY2024: Factory ramps did not translate into volume growth; total production was essentially flat. broken
- Promised in FY2023 10‑K: Ongoing focus on “improve vehicle performance, decrease production costs and increase affordability.” → Actual FY2024: Revenue grew only 0.9% despite aggressive pricing; affordability was maintained but with further margin compression. Operating income fell 20.4%. broken (profitability deteriorated)
FY2024 → FY2025:
- Promised in FY2024 10‑K: “We are focused on profitable growth” and “increasing vehicle production, utilized capacity and delivery capabilities.” → Actual FY2025: Revenue fell 2.9% (to $94.8B), deliveries declined to 1.64M units. Operating income collapsed 38.5% to $4.36B, net income nearly halved to $3.79B. broken
- Promised in FY2024 10‑K: “Reducing costs” and “further cost reductions and operational efficiencies.” → Actual FY2025: Operating margin compressed to 4.6% (from 7.2%), the lowest in the period. Margin compression accelerated, showing cost reductions were insufficient or offset by price cuts. broken
- Promised in FY2024 10‑K: “Ramping the production and increasing the market penetration of our energy storage products.” → Actual FY2025: Energy storage deployments surged to 46.7 GWh (+49%). kept
- Promised in FY2024 10‑K: “Further improving and deploying our FSD (Supervised) capabilities, including future autonomous capabilities through our purpose‑built Robotaxi product, Cybercab.” → Actual FY2025: Robotaxi service launched in June 2025. kept
- Promised in FY2024 10‑K: Battery and AI compute technology development; “vertically integrating and localizing our supply chain.” → Unclear measurable progress by year‑end 2025. unverifiable
Pattern Observed
Aggregate count: 7 kept · 1 partial · 7 broken · 3 unverifiable across 3 transitions.
Management consistently over‑promises on core automotive growth and margin improvement while delivering on new product launches and energy storage. The operating narrative (“cost reductions,” “production efficiencies”) is repeated even as margins decline year after year, indicating a systematic optimism bias. When results deteriorate, the outlook pivots toward new technology narratives (FSD, Robotaxi, AI) rather than candidly addressing the structural margin compression in the legacy auto business.
Language Evolution
- From “production growth” to “profitable growth”: FY2022 MD&A emphasized “ramping all… vehicles to their installed production capacities.” By FY2024 MD&A the phrase “profitable growth” appeared, trying to signal discipline, yet actual profitability cratered in FY2025.
- Rise of AI/Robotaxi language: FY2023 MD&A still focused on “vehicles, battery technologies, FSD.” FY2024 MD&A introduced “purpose‑built Robotaxi product, Cybercab” and “accelerate our AI, software, and fleet‑based profits.” FY2025 MD&A (FY2026 10‑K) opened with “We are focused on bringing artificial intelligence into the real world,” demoting the automotive mission. This shift suggests management redirects narrative away from the stalling core auto business.
- Disappearing “cost reduction” credibility: “Cost reduction efforts” and “operational efficiencies” were frequently used, but after FY2023’s operating margin implosion, the terms lost conviction; by FY2025, they were hollow mentions amid continued margin decline.
- Tone shift: The FY2022 and FY2023 MD&A were upbeat about volume ramp and efficiency; the FY2024 MD&A, while still optimistic, inserted cautious language about “uncertainties inherent in establishing and ramping manufacturing operations.” By the FY2025 MD&A (for 2025), language turned defensive: “rapidly evolving trade and fiscal policy, uncertainty… risks to our global supply chain… could have a meaningfully adverse impact.” The tone moved from confident to blame‑the‑environment.
Specific Kept Promises (credibility deposits)
- Tesla Semi pilot production: Teased in FY2022 MD&A as an upcoming new vehicle; pilot production began in FY2023 at Gigafactory Nevada. Kept.
- Cybertruck launch: Described as “Tooling” in FY2022, “Active” in the FY2023 outlook; deliveries started in FY2024. Kept, albeit years later than originally promised, but within the explicit forward‑looking window.
- Energy storage ramp: Promised in FY2024 MD&A to ramp production and market penetration; storage deployments leaped from 31.4 GWh in 2024 to 46.7 GWh in 2025 (+49%). Kept.
- Factory ramps (Berlin / Texas): Both factories were active and contributed to the FY2023 delivery jump from 1.31M to 1.81M units, fulfilling the FY2022 promise. Kept.
- Robotaxi service launch: Although not given a specific date in FY2024 MD&A, the focus on Cybercab and autonomous capabilities culminated in a June 2025 launch. Kept.
Specific Broken Promises (credibility withdrawals)
- Profitability improvement (FY2022→2023): The narrative of “improving our profitability” was contradicted by a 34.9% operating income decline, from $13.66B to $8.89B. The only reason net income rose was a $5.93B one‑time tax benefit. Broken.
- Cost reductions protecting margins (FY2023→2024): Despite stating “further cost reductions and operational efficiencies,” operating margin fell to 7.2% (‑2.0pp). Delivery volumes slightly declined, showing cost cuts did not keep pace with price competition. Broken.
- Revenue and volume growth (FY2023→2024): Management highlighted “maximizing delivery volumes” and factory ramps, yet deliveries decreased 1.1% and revenue advanced only 0.9%. The expectation of continued growth was unmet. Broken.
- “Profitable growth” and “increasing vehicle production” (FY2024→2025): FY2024 MD&A’s explicit emphasis on profitable growth failed spectacularly: revenue down 2.9%, deliveries down 8.4%, net income down 46.5%. The promised increase in vehicle production turned into a steep decline. Broken.
- Cost reduction delivering margin improvement (FY2024→2025): Again, with “further cost reductions and operational efficiencies,” operating margin fell further to 4.6%, the lowest of the period, signaling that either cost reductions were insufficient or pricing pressure overwhelmed them. Broken.
Spin & Euphemism Patterns
- “Affordability” as a shield for margin erosion: In FY2022 and FY2023 MD&A, “increase affordability” was presented as a goal achieved through cost innovation; in reality, it was executed through massive price cuts that decimated margins. The phrase obscures the trade‑off.
- “Challenging environment” / external scapegoating: When results weakened, management increasingly cited external factors: “industry‑wide component constraints” (FY2022), later “rapidly evolving trade and fiscal policy, uncertainty… tariff regime” (FY2025). These are used to deflect from the failure of internal cost targets.
- “Investing for the future” / “capital‑intensive projects”: The company justified rising capex and falling FCF with this language, but in FY2025, when it cut capex by 24.8% to boost FCF, the narrative did not acknowledge the retreat. This inconsistency makes the “investing” mantra a convenient pivot.
- One‑time tax benefit distortion: In FY2023, net income hit a record, but management’s commentary only briefly noted the $5.93B tax benefit. The strong income figure was allowed to dominate the narrative while the severe operating decline was under‑emphasized, a classic misdirection.
- Narrative rebranding: As auto margins crumbled, the MD&A shifted focus from automotive production growth to “AI, software, and fleet‑based profits” and then to “bringing artificial intelligence into the real world.” This evolution looks less like genuine strategy change and more like re‑framing the story to distract from a deteriorating core business.
Credibility Grade (A–F)
D
Management’s forward‑looking statements on automotive profitability and volume growth have been consistently wrong, with a clear pattern of over‑optimism that repeatedly failed to materialize. While product launches (Cybertruck, Semi, Robotaxi) were eventually delivered, the core operational promises—cost reductions, margin stability, delivery growth—were broken across multiple years. The narrative consistently downplays negative intra‑year developments and pivots toward novel technology theses when results sour, eroding trust in the MD&A as a reliable guide for future performance.
Management’s tone has subtly shifted from hyperbolic confidence on near-term autonomous milestones to a more guarded, qualify-every-commitment posture. In July 2025, Musk set an explicit target to have “no safety drivers in at least large parts of Austin by the end of this year” and coverage of half the U.S. population for robotaxi by year‑end. By October, that Austin target was reiterated, and timelines remained aggressive. But when January 2026 arrived, the removal of safety drivers went unmentioned; the robotaxi fleet count was floated instead, and the bold year‑end coverage goal had evaporated. By April 2026, the narrative had shifted entirely to the next FSD version’s “5 or 6 fold improvement” and a nebulous “by Q2 next year” safety metric, without ever acknowledging the missed 2025 promises. That arc—from concrete, short‑dated commitments to vague, longer‑dated aspiration without addressing prior misses—is a classic tell of evasion.
The April call’s Cybercab production target illustrates the same pattern. In January, Musk stated flatly, “We expect to start production in April.” In the April transcript, there is no mention of production having started, nor any explanation for a delay; instead, “volume production is targeted for 2026” is the only reference. When pressed by facts, management has a habit of simply moving the goalpost further into the future while acting as if the prior promise never existed.
On evasiveness in the face of hard questions, the summaries lack verbatim Q&A, but the prepared remarks show a clear tendency to pivot to vision when confronting margin compression, tariff headwinds, and execution risk. Tariff impacts were cited at over $400 million in Q3 2025 and $300 million sequentially in Q2, yet the framing quickly segues to AI compute, Optimus, or the “infinite money glitch” potential. When warning that sustaining Q3 2026 automotive margins “will be challenging given the current economic environment,” management blames external macro forces rather than internal execution or cost structure—an externalization that feels scripted.
The CFO, Vaibhav Taneja, is present on all calls and handles operational specifics like OpEx and tariff breakdowns, which is positive. However, the out‑sized visionary promises consistently fall to Elon Musk, and the gap between those promises and the operational updates delivered by Taneja and the team is widening. When the operational reality fails to materialize, the visionary promise simply gets replaced with a new one, with no one on the call holding management to account for the prior miss.
Guidance confidence is selectively aggressive. The April “best guess” of 20%–30% vehicle growth next year is hedged with “some force majeure events, like some big war breaks out or interest rates go sky high”—a de‑risking hedge that makes the number essentially unfalsifiable. The January capex guidance jump to “exceed $20 billion” is tied to six factories and AI compute, but no clear return timeframe is offered, and the margin‑dilutive shift to FSD subscriptions is downplayed as a short‑term headwind.
Specific commitments worth tracking: the Cybercab April 2026 production start (already missed with no disclosure), the Q2 2027 FSD safety superiority claim, the 5–6x intervention improvement for V13, and the Reno Semi factory pilot builds now pushed to the second half of “next year” (likely 2027). These are concrete but conveniently distant.
Net assessment: EVASIVE. Management consistently sets concrete, ambitious near‑term targets that vanish without acknowledgment, blames external factors for misses, and pivots to more distant, grander ambitions rather than addressing operational shortfalls. The absence of a transparent mea culpa on the Austin safety‑driver and Cybercab timelines, combined with the externalization of margin pressures, suggests a carefully scripted, credibility‑eroding approach.
Quarterly trajectory
- Revenue shows a pronounced seasonal pattern: Q3 quarters (peak delivery quarter) consistently far exceed Q1 quarters. Q3 2024 revenue was $71.98B, Q3 2025 was $69.93B — a YoY decline of 2.8%. Q1 2026 revenue of $22.39B was up 15.8% YoY from Q1 2025’s $19.34B, marking the first YoY growth in a Q1 since Q1 2024.
- Net income followed the same seasonal shape but with compressed margins. Q3 2024 NI was $4.96B, Q3 2025 NI fell to $2.95B (‑40.5% YoY). Q1 2026 NI of $477M improved 16.6% YoY from Q1 2025’s $409M.
- Operating cash flow exceeded net income in every quarter except Q1 2024, where OCF was only $242M vs. NI of $1.39B. That quarter appears to reflect a large working capital outflow (likely inventory build or accounts receivable timing). Otherwise, OCF ranged from 2x to 3.7x NI, indicating strong cash conversion.
- Sequential (QoQ) trend over the last four quarters: From Q1 2025 to Q3 2025, revenue grew from $19.34B → $41.83B → $69.93B (accelerating), then dropped to $22.39B in Q1 2026 (seasonal). NI followed the same pattern. The Q1 2026 recovery vs. a year earlier is a potential inflection point for the revenue cycle, but peak‑quarter levels remain below prior peaks.
Quality of earnings
STRONG — Operating cash flow exceeded net income in seven of the last eight quarters. The only exception was Q1 2024 (NI $1.39B vs. OCF $242M), an outlier likely caused by a temporary working capital drain. In Q1 2026, OCF of $3.94B was 8.3x NI of $477M, implying significant non-cash items (e.g., stock‑based compensation, depreciation) and/or beneficial working capital timing. The consistent OCF‑over‑NI pattern suggests earnings are underpinned by actual cash generation, not accruals. No yellow flags from persistent divergence.
Recent inflection
The single most important inflection point is Q1 2024. In that quarter, revenue collapsed from $71.61B (Q3 2023) to $21.30B — a 70% sequential drop that was larger than typical seasonality — and net income fell from $7.07B to $1.39B. This marked the end of the high‑growth trajectory seen through 2023. The MD&A confirms 2025 full‑year revenue declined $2.86B vs. 2024, attributing the slowdown to trade policy uncertainty and tariff impacts. Since Q1 2024, the company has operated in a lower revenue / margin regime, with Q3 peaks declining each year (Q3 2024: $71.98B → Q3 2025: $69.93B).
Forward read
Based on the trajectory of the most recent quarter (Q1 2026), I would expect the following for Q2 2026:
- Revenue: ~$44–$46B, representing YoY growth of +5% to +10% vs. Q2 2025 ($41.83B). The historical Q1→Q2 step‑up factor is ~2.0–2.2x (Q1 2024→Q2 2024: 2.2x; Q1 2025→Q2 2025: 2.2x). Q1 2026’s $22.39B supports a Q2 projection in that range.
- Net income margin: ~3.5% (from Q2 2025’s 3.8%), implying net income of approximately $1.6B. This assumes no material change in automotive gross margins or energy storage profitability, and normal sequential working capital dynamics.
- Assumptions: Seasonality holds; no further escalations in tariffs; robotaxi service launches (noted in MD&A) do not yet materially impact revenue; no new dilutive equity offerings.
Risks the quarterly data flags
- Declining peak‑quarter revenue and profitability: Q3 2025 revenue ($69.93B) was below Q3 2024 ($71.98B), and Q3 2025 NI ($2.95B) was well below Q3 2024 ($4.96B). If this downward trend continues into Q3 2026, full‑year revenue and cash flows may come in below consensus expectations.
- Working capital tailwind may reverse: In Q1 2026, OCF of $3.94B relative to NI of $477M implies a large positive working capital benefit (likely from payables or deferred revenue). If this benefit normalizes in subsequent quarters, OCF could fall, compressing free cash flow. The MD&A noted 2025 OCF of $14.75B vs. 2024’s $14.92B — a slight decline despite higher NI in 2025 — hinting at working capital drag that may continue.
- Tariff exposure concentrated in energy business: The MD&A explicitly warns that tariffs have a “relatively larger impact on our energy generation and storage business.” With 2025 energy storage deployments of 46.7 GWh, any margin compression there could weigh on consolidated gross profit. The Q1 2026 data does not break out segment results, but the sequential improvement in NI from Q1 2025 may be fragile if energy margins deteriorate.
- Lumpy cash flow pattern: OCF in Q1 quarters historically varies dramatically (Q1 2024: $242M; Q1 2025: $2.16B; Q1 2026: $3.94B). This inconsistency suggests reliance on timing of working capital items, making annual OCF projections less reliable and increasing the risk of a negative surprise if a quarter’s inflow reverses.
The Moat
Tesla’s moat is under siege and may already be breached. Warren Buffett’s acid test is whether a business can consistently earn returns on tangible capital well above its cost — and protect those returns against competition. A decade ago, Tesla looked like it might clear that bar: early entry into EVs, a superior charging network, manufacturing innovations, and a brand that commanded premium pricing. The numbers say that moat existed for roughly two years.
ROIC peaked at 36.6% in FY2022 [pc], an extraordinary figure for an automaker. But the peak was fleeting. ROIC then fell to 14.4% (2023), 9.0% (2024), and 4.8% in FY2025 [pc] — a four‑year decline that the forensic system flags as a “moat erosion signal” [pc]. At 4.8%, ROIC barely exceeds the 10‑year risk‑free rate of 4.57% [macro], meaning the business no longer earns an economic spread. The median ROIC over the full ten years is –1.84% [pc], and only two years (2021, 2022) exceeded 15%. The competitive forces that overwhelm auto manufacturing — every major manufacturer now sells compelling EVs — are doing exactly what moat theory predicts: they are pulling returns down toward the cost of capital.
Pricing power has evaporated. Operating margin has slumped from 16.8% to 4.6% over three years [pc], even as management claims ongoing cost‑reduction victories. If the company had a durable franchise, it could price above inflation and hold margins. Instead, it has cut prices to defend volumes, and every cut drops directly to the bottom line while cost savings fail to offset the damage. The cash conversion cycle, once a hidden asset (suppliers effectively financing Tesla at –26 days in 2021), has normalized to +13 days [pc]. The structural advantages — first‑mover brand mystique, the Supercharger network as a switching cost — are being competed away. The moat is not just narrowing; it is disappearing in real time, and Tesla’s own financials are the evidence.
What Could Go Wrong
The risks here are not theoretical. They are a live‑action continuation of the trends already underway.
Start with the warranty reserve. The auditor’s critical audit matter explicitly flags the $8,607 M automotive warranty reserve as requiring “significant judgment” and “especially challenging, subjective, or complex judgments” [10K‑FS‑2026‑p1]. The independent audit firm brought in its own specialists to re‑estimate the liability. If claims frequency or severity on a fleet of millions of vehicles turns out to be worse than management estimates, a material top‑up is plausible. A 20% adverse development would be $1.7 B, equal to 39% of FY2025 operating income — a blow that would wipe out a large chunk of already‑thin profits.
Then layer in the tariff exposure. Management itself warns that “the current tariff regime will have a relatively larger impact on our energy generation and storage business” [10K‑MDA‑2026‑p1], the one segment that is actually growing. Energy storage deployments surged to 46.7 GWh (+49%) [10K‑MDA‑2026‑p1], but tariffs could compress those margins while automotive margins simultaneously deteriorate.
The most insidious risk is the deferred compensation time bomb. The $23.7 billion CEO Interim Award and the multi‑tranche 2025 CEO Performance Award are not yet expensed; management will book the charge only when the performance condition becomes “probable” [er]. When that happens — and it will happen at the moment of maximum dilution — a multi‑billion‑dollar catch‑up expense will devastate a single quarter’s reported earnings. At a market cap of $1.61 trillion, the stock may have discounted the dilution in share count, but it has not priced in the sudden earnings shock that will dominate headlines.
Macro compression would take these fundamentals and multiply the damage. CAPE 42.0 and the Buffett indicator at 229.6% [macro] sit at levels that have historically preceded decade‑long poor equity returns. Tesla trades at 420× earnings [pc], so any re‑rating from growth‑fantasy multiples to low‑multiple auto multiples would be catastrophic even without a recession. But include one, and the downside looks like the stress‑test scenarios: intrinsic value of $43.61 in a plain‑vanilla recession, $17.54 in a 2008‑style credit crisis, $18.99 in stagflation [pc]. The sensitivity grid shows that even generous assumptions — 10% revenue growth and margins 4 points above today — yield IV of only $53 [pc]. The market is not pricing downside; it is pricing a single perfect‑outcome narrative while the business’ own numbers are telling a different story.
Capital Allocation & Compounding
Tesla’s capital allocation record — zero share repurchases, zero dividends, zero acquisitions across five fiscal years [er], combined with persistent dilution from stock‑based compensation — is a clear failure from the perspective of outside shareholders. The stock‑based comp burden averages 50.2% of reported FCF [pc], meaning that half of the cash flow shareholders think they own is quietly transferred to employees and executives. Shares outstanding have risen +30.3% in the last five years [pc], and the $23.7 billion CEO restricted share award [er] guarantees further dilution.
The board’s response to this dilution trajectory has been to insulate itself rather than return capital. In 2025, Tesla adopted a jury‑trial waiver for shareholder claims and a 3% ownership threshold for derivative suits [er]. That is the posture of a management team that expects conflict with its owners, not one that is stewarding their capital.
On the Hohn anti‑list: auto manufacturing has never been a good business for minority shareholders. It is capital‑intensive, cyclical, and commoditized. The AI narratives — Robotaxi, FSD, Optimus — are the reason this stock trades at $429 and not $56, but they have no material revenue and no basis in audited financials. Even the energy storage business, while growing, is tariff‑exposed and would need to expand by an order of magnitude to offset the auto decline. The thesis for this stock rests entirely on optionality, not on compounding. The capital that has been spent — $8.9 B in capex in 2023, $11.3 B in 2024 [dp] — has produced declining returns. The capital that has been cut — $8.5 B in FY2025 [dp] — produced a FCF spike that was entirely mechanical, not a reflection of business quality. This is not compounding; it is cannibalizing future growth to dress a present‑tense cash flow number.
Governance Quality
Executive Compensation
The 2025 proxy statement does not present a conventional Summary Compensation Table for the most recent fiscal year; instead, it focuses on a forward‑looking 2025 CEO Performance Award and a recent 2025 Interim Award. Elon Musk has received no meaningful compensation since the 2012 CEO Performance Award fully vested in 2017 – nearly eight years ago – because the 2018 CEO Performance Award remains mired in Delaware litigation. The 2025 Interim Award (granted August 2025) is described only as an initial “first step,” with no dollar value or share count disclosed. Consequently, absolute CEO pay for 2024, cash/equity mix, and year‑over‑year change cannot be determined from the provided materials.
The proposed 2025 CEO Performance Award is a purely equity‑based, performance‑driven grant of restricted stock. It contains 12 tranches, each requiring a paired market‑capitalization milestone and operational milestone. Market‑cap thresholds escalate from $2 trillion to $8.
Persona Deliberations
Each persona has now read the full draft thesis above and written a structured critique — what they agree with, what they push back on, and their bottom line. This is where each takes their stand.
Warren Buffett — Reading the Thesis
What I agree with
The thesis gets the central fact of the case exactly right: the numbers have turned decisively against this business. Operating margin has contracted from 16.8% to 4.6% over three years, and ROIC has collapsed from 36.6% to 4.8% — now barely above the 4.57% risk‑free rate. When a capital‑intensive manufacturer begins earning returns that fail to clear its cost of capital, the economic engine is broken. The thesis correctly identifies that the FCF surge in 2025 ($6,220M) was a mirage — achieved by slashing capex 24.8% — not a sign of improving quality. I also agree that stock‑based compensation, which has averaged 50.2% of reported FCF, makes the headline free cash flow deeply misleading. True owner earnings after dilution are a fraction of the reported figure. The management credibility grade of D is well‑supported by the breakdown of 7 broken promises versus 7 kept, with the kept ones clustered around product launches and the broken ones squarely in the core metrics of profitability and volume growth. The pattern of setting aggressive near‑term targets — Austin safety‑driver removal, Cybercab production start — missing them without acknowledgment, and pivoting to new visions, is exactly the kind of evasive habit that destroys shareholder trust. The thesis’s final warning that the $23.7 billion CEO interim award will inflict a sudden earnings charge when the performance condition becomes probable is an important and under‑appreciated risk.
What I’d push back on
The thesis declares a verdict of “Pass” with moderate conviction and a quality score of 5/10. Given its own analysis, that conclusion is too generous. The intrinsic value range is $46‑$60, and the stock is at $429. Even the most optimistic sensitivity — 10% growth and a 4‑point margin lift — yields only $53 per share. The margin of safety is –670%. A business whose returns on tangible capital have fallen below the risk‑free rate, whose revenue is shrinking, and whose management systematically over‑promises and dilutes shareholders, is not a “5/10” quality business in my book. It is a sub‑par business with a speculative stock price. The gap between price and value here is so vast that no rational investor would consider it “on the watchlist” at current levels. If the thesis truly believes the business is deteriorating and the moat is eroding, the only logical verdict is “Avoid.” The “Pass” may be unintentional charity toward the narrative of optionality in AI and robotics, but the thesis itself correctly labels those as outside the circle of competence and unsupported by disclosed revenue. When you have a business whose current economics are weak and whose forward promises are unverifiable, at a price that implies 50%+ growth, you don’t pass—you walk away.
Additionally, the thesis frames the moat as having “existed for roughly two years.” I’d argue that even that is misleading. The two years of high ROIC (2021 and 2022) coincided with a unique period: pandemic‑era supply constraints limited competition, and Tesla enjoyed a pricing umbrella that inflated margins. The median 10‑year ROIC is –1.84%. A two‑year spike amidst a decade of capital‑destroying returns is not a moat; it’s a temporary windfall. The business never developed durable pricing power or competitive insulation. The so‑called “moat erosion” is really just the unwinding of a favorable but unsustainable market anomaly.
I’d reverse my view if Tesla achieves a trailing twelve‑month operating margin above 10% and an ROIC above 15% over two consecutive fiscal years, with no decline in unit deliveries, and with management explicitly tying forward guidance to audited automotive profitability rather than to AI or robotics narratives. That would be the first evidence of a genuine, defensible franchise.
My bottom line
AVOID. The current price embeds a fantasy of uninterrupted growth that the financial statements actively contradict. The core automotive operation is generating returns below its cost of capital, management has a track record of broken promises and shareholder dilution, and the balance‑sheet strength is being squandered on massive equity awards rather than returned to owners. At a price‑to‑owner‑earnings multiple that is off the scale relative to the business’s deteriorating fundamentals, this is not a stock I’d buy at any price near $429.
Seth Klarman — Reading the Thesis
What I agree with
The core warning is correct: the downside here is not hypothetical — it's arithmetic. The DCF base case yields $55.73 per share against a price of $428.96, a margin of safety of –669.8% [pc]. The reverse‑DCF implied growth of +50.0% means the market is pricing in a trajectory that no reasonable framework can support. That alone puts this in the “impossible to underwrite” category. I agree with the granular breakdown: ROIC has collapsed from 36.6% to 4.8% over four years [pc] — a figure that barely clears the risk‑free rate of 4.57% — and the median ROIC over the full cycle is –1.84% [pc]. The moat erosion signal is real and supported. I also concur that management’s credibility is beyond salvage: a D grade, an evasive pattern across three transitions, and 7 broken promises against 7 kept [cred]. The stock‑based compensation reality — 50.2% of reported FCF on average [pc], diluting shareholders by +30.3% over five years [pc] — means true owner earnings are a fraction of the headline FCF. The $8,607M warranty reserve flagged by the auditor [10K‑FS‑2026‑p1] is a live wire: a 20% adverse development equals 39% of FY2025 operating income. The thesis correctly identifies that the market is buying a narrative (Robotaxi, FSD, Optimus) that has no material revenue while the core auto business — $94.8B in revenue, $4.4B in operating income — is shrinking and structurally compressing. These are not opinions; they are the financial statements.
What I’d push back on
The thesis’s DCF base case of $55.73 [pc] is almost certainly too generous, because it appears to rely on reported FCF rather than true after‑SBC owner earnings. Once you deduct SBC from FCF — and the thesis itself shows true FCF after SBC was only $3,395M in FY2025 [pc], not $6,220M — the intrinsic value would be substantially lower. Using a basic perpetuity of that adjusted FCF at a 10% discount produces a value closer to $34B total, or roughly $10‑$12 per share, not $55. The IV estimates provided may therefore understate the actual downside. Furthermore, the stress‑case scenarios ($43.61 plain recession, $17.54 2008‑style, $18.99 stagflation) all assume that the business survives as a going concern with some revenue base. But we must ask: in a consumer recession that chokes auto lending and forces further price cuts, could the core business burn cash? The balance sheet has $16.5B of cash and $6.6B of debt, but that cash is not truly surplus if the company must continue funding capex (they guided to “exceed $20B” [er]) and potential warranty settlements. The “fortress” liquidity is partly encumbered by the investment‑grade spending appetite and by the reality that much of it may be needed to absorb operating losses if automotive margins slip below breakeven. A more severe downside — not a 2008 credit‑event replay, but a demand‑cycle shock specific to Tesla’s aging product line and tariff‑exposed energy segment — could wipe out equity value entirely. Finally, the deferred $23.7B CEO award is an earnings bomb that hardly damages cash flow directly, but the reputational and multiple‑compression fallout when that charge hits the income statement is not priced into the DCF. The market could re‑rate the stock from “AI visionary” to “SBC‑riddled auto manufacturer” overnight.
I’d reverse my view if, in the next four consecutive quarters, Tesla reports (a) FCF after SBC exceeding $1 per share per quarter, (b) ROIC rising above 12%, and (c) automotive revenue growth turning positive with operating margins above 10%, all while dilution remains below 5% annualized.
My bottom line
AVOID — The margin of safety is not just negative; it’s fundamentally indeterminate because the intrinsic value after adjusting for true owner earnings is plausibly below $20 per share, compared to a price of $429. Permanent capital loss risk is severe. The business is a low‑return auto manufacturer dressed in AI‑narrative premium, with a management team that has systematically diluted shareholders while delivering declining profitability. There is no price at which I would underwrite an investment here.
Chris Hohn (TCI) — Reading the Thesis
What I agree with
The thesis correctly identifies that Tesla lacks the durable barriers to entry that define a structurally good business. ROIC has collapsed from 36.6% in FY2022 to 4.8% in FY2025—barely above the 4.57% risk‑free rate—and the 10‑year average ROIC is –10.8%. Only two years out of the last ten produced returns above 15%. That trajectory is precisely what you would expect when a first‑mover advantage in a capital‑intensive, commoditising industry is competed away. The cash conversion cycle reversal from –26 days (supplier financing) to +13 days, and the operating margin compression from 16.8% to 4.6%, confirm the loss of any pricing‑power or structural cost advantage. The capital allocation record is also damning: +30.3% share dilution over five years, stock‑based compensation consuming 50.2% of reported free cash flow, zero buybacks, and a $23.7 billion CEO award that will further dilute outside shareholders. These are not the markings of a compounding machine; they are the marks of a business where the economic returns accrue to insiders, not shareholders.
What I’d push back on
The thesis rates Tesla’s quality as 5/10 and its verdict as a “Pass.” That understates the severity of the moat failure. The energy‑storage business is genuinely growing (46.7 GWh deployed, +49%), but it is tariff‑exposed, lacks a disclosed ROIC above the cost of capital, and has no evidence of network effects, switching costs, or IP complexity that would sustain returns above 15% independently. The AI narratives—Robotaxi, FSD, Optimus—are revenue‑less and rest on a management track record that has repeatedly missed self‑imposed deadlines. In an 8‑plus‑year hold framework, a business that earns 4.8% on tangible capital today and has a ten‑year median ROIC of –1.84% does not belong on a watchlist; it belongs on the anti‑list. The auto‑manufacturing sector is structurally bad, and Tesla offers no exceptional moat that justifies an exception—its high‑ROIC period was a fleeting supply‑demand anomaly, not a sustainably wide barrier. I’d reverse my view if Tesla demonstrates a five‑consecutive‑year ROIC above 15% across all segments, with energy/AI generating over 30% of revenue and margins that prove pricing power disconnected from subsidies, but the next decade’s competitive dynamics give no basis to expect that.
My bottom line
AVOID. Auto manufacturing is on my structural anti‑list, and Tesla’s financials—4.8% ROIC, operating margin slumping to 4.6%, and negative economic spread—confirm the moat never became durable. The dilution cascade (+30% share count) and the management’s evasiveness on core profitability goals disqualify any sleep‑at‑night conviction. No exceptional barrier to entry exists that would lift this business out of the commodity trap.
Jim Chanos — Reading the Thesis
What I agree with
The thesis correctly surfaces the structural decay in Tesla’s core financials. ROIC collapsing from 36.6% to 4.8% over four years—barely above the 4.57% risk‑free rate—is a textbook moat‑erosion signal, and the median ROIC of –1.84% over a decade confirms the two high‑return years were an anomaly, not a franchise. The capital‑allocation grade of D is spot‑on: zero buybacks or dividends, shares outstanding up +30.3% in five years, and SBC averaging 50.2% of reported FCF—shareholders have been diluted while management and the board hoard liquidity. The FY2025 FCF illusion ($6,220 M headline, $3,395 M after SBC) entirely driven by a $2,815 M capex cut is exactly the kind of cash‑flow mirage I hunt, and management’s credibility analysis—7 broken promises on profitability and volume, evasive AI pivots—destroys any reason to trust forward guidance.
What I’d push back on
The thesis’s “quality of earnings” verdict of STRONG is dangerously misleading. Observing that OCF exceeded NI in seven of eight quarters misses the entire point: stock‑based compensation is a real dilution cost, not a free form of employee payment. After deducting SBC, true free cash flow available to equity holders in FY2025 was only $3,395 M [pc]—a 2.1% yield on the current price. The share count has risen +30.3% in five years, and the $23.7 B CEO Interim Award will push that far higher. Calling earnings high‑quality while ignoring a 50% FCF haircut from dilution is forensic blindness.
The single most compelling reason this stock could be down 50% three years from now is an earnings shock from the $8,607 M warranty reserve, combined with the sudden recognition of the deferred CEO compensation expense. The auditor’s critical audit matter notes the warranty reserve requires “especially challenging, subjective, or complex judgments.” A 20% adverse development—$1.7 B—would wipe out 39% of FY2025’s already‑thin operating income, and with an aging fleet (Model 3/Y now five years on the road), claims severity could easily force a top‑up. Meanwhile, the $23.7 B Interim Award’s expense hasn’t been booked; when the performance condition becomes “probable,” a multi‑billion‑dollar charge will devastate a single quarter’s earnings—and that charge is inevitable within 2–3 years. If that quarter also sees tariff‑compressed energy margins and continued auto revenue declines, Tesla could report a quarterly loss exceeding $5 B, exposing the absurd 420× earnings multiple and forcing a re‑rating toward single‑digit auto multiples. The thesis nods at these risks but underweights the compounding effect of simultaneous accounting hits.
I’d reverse my view if, over the next four quarters, Tesla’s core automotive gross margin ex‑regulatory credits stabilizes above 15% for two consecutive quarters, FSD subscription revenue reaches a $2 B annual run‑rate with high renewal rates, and the company conducts meaningful share repurchases rather than issuing hundreds of millions in new equity.
My bottom line
SHORT_HIGH_CONVICTION. The DCF intrinsic value of $55.73 against a $428.96 price is not a valuation divergence—it’s a chasm. ROIC has collapsed to 4.8%, management credibility is D‑grade and evasive, and the coming convergence of a warranty reserve blowup with the $23.7 B deferred comp charge will expose the true, single‑digit billion true FCF reality under a $1.61 T market cap. I’d short with size and use puts to capture the inevitable mean‑reversion toward auto‑cyclical multiples.
Persona Rebuttals
Each persona has now read the other three's Phase 4.5 critiques and writes a focused rebuttal. This is where they engage with each other's reasoning, identify the strongest counter-arguments, and state whether any of them have changed their mind.
Seth Klarman — Rebuttal
Where the others sharpened my view
Chanos surfaced the one risk that genuinely widens the plausible worst-case beyond what I modeled. He specifically flags “an earnings shock from the $8,607M warranty reserve, combined with the sudden recognition of the deferred CEO compensation expense,” noting that “the $23.7B Interim Award’s expense hasn’t been booked” and that when it becomes probable, “a multi-billion-dollar charge will devastate a single quarter’s earnings.” He then compounds this: “If that quarter also sees tariff-compressed energy margins and continued auto revenue declines, Tesla could report a quarterly loss exceeding $5B.” That is a non-linear downside event my earlier stress scenarios—which assumed going-concern survival with some revenue base—did not fully capture. The simultaneous crystallization of a warranty charge equal to 39% of operating income and a compensation charge representing years of deferred dilution creates a credibility cascade that could trigger a multiple repricing well before the DCF arithmetic plays out. This is not a 2008-replay scenario; it is an accounting-convergence tail risk specific to this company’s aggressive deferral of real costs. His forensic specificity strengthens the case that the downside is not merely severe—it is binary.
Where I push back on the others
Buffett’s critique, while directionally correct, commits the error of anchoring on “owner earnings” within a framework that wobbles on the margin-of-safety number itself. He states the intrinsic value range is “$46-$60” and describes a –670% margin of safety as disqualifying—yet his own capital-preservation discipline should demand far more precision before concluding that range is usable. The base-case DCF of $55.73 already overstates value because it uses reported FCF, not true after-SBC owner earnings. Once you deduct SBC—which consumed 50.2% of reported FCF, leaving $3,395M in FY2025—a no-growth perpetuity at 10% yields roughly $10-$12 per share, not $55. The margin of safety against $429 is not –670%; it is –3,500% or worse. Buffett’s instinct to walk away is correct, but by repeating the DCF’s $55 figure, he inadvertently legitimizes a valuation anchor that is itself dangerously optimistic. A true downside-first investor does not bracket intrinsic value between $46 and $60 when the raw numbers suggest it may be an order of magnitude lower. The gap is so vast that even a “Pass” or “Watchlist” posture risks someone mentally reserving a price at which this becomes a buy—and no such price exists within any plausible framework.
Has my bottom line changed?
My verdict remains AVOID. Chanos’s convergence scenario reinforces, rather than alters, the core arithmetic: the intrinsic value after properly deducting dilution costs is plausibly below $20 per share, and the catalytic risk of a simultaneous warranty-plus-compensation charge makes permanent capital loss near-certain at $429. I do not underwrite investments where the margin of safety is not merely negative but fundamentally un-anchorable. I would reconsider only if the stock fell below $87—a level that would imply an after-SBC true FCF yield of 12% on a no-growth basis, with a balance sheet adjusted for the full probability-weighted burden of the deferred compensation award and warranty reserve. That is the price at which a margin of safety becomes a number, not a slogan. Until then, no argument about “quality” or “optionality” overrides the simple truth that you cannot pay $429 for a dollar of owner earnings that costs you $35 in dilution-adjusted value.
Chris Hohn (TCI) — Rebuttal
Where the others sharpened my view
Buffett crystallized why Tesla’s high‑ROIC window was never a moat — it was a “temporary windfall” from a pandemic‑era supply‑demand anomaly that inflated margins, not a durable competitive insulation. The median 10‑year ROIC of –1.84% confirms the business never had pricing power independent of a fleeting umbrella. Klarman’s forensic correction on true owner earnings (FCF after SBC a mere $3,395M, not $6,220M) reinforces that the economic returns available to equity holders are miniscule relative to the $1.61T market cap, further invalidating any notion of a compounder. Chanos’s highlight of the $8,607M warranty reserve — where 20% adverse development erases 39% of FY2025 operating income — sharpens the point that even the remaining after‑SBC FCF is at risk from liabilities embedded in an aging fleet. These sharpen my original verdict: no structural barrier to entry can exist when the core auto business earns returns barely above the risk‑free rate and carries contingent claims that can swamp the equity.
Where I push back on the others
Buffett says he’d reverse his view with two consecutive years of operating margin >10% and ROIC >15%. That is too lenient for an 8+‑year hold. Cyclical auto manufacturers can hit those thresholds temporarily — a sustained structural barrier requires at least five consecutive years of ROIC above 15% across all segments, driven by pricing power decoupled from subsidies. Klarman’s four‑quarter trigger (FCF after SBC >$1 per share, ROIC >12%) is even shorter‑term and could be gamed by another capex cut, not genuine moat evidence. Chanos identifies a potential short catalyst, but his reversal condition — $2B FSD revenue run‑rate and buybacks — is speculative; AI narrative revenue doesn’t constitute a barrier to entry unless supported by switching costs or network effects Tesla has never demonstrated. I will not relax my non‑negotiable: a structurally good business must show a long‑run, intrinsic return advantage that is obvious and durable, not a snapshot of sentiment or a single product cycle.
Has my bottom line changed?
No. My bottom line remains AVOID. The other personas’ critiques only reinforce the thesis that Tesla never possessed a structural moat. The specific observable evidence that would move me to ACCUMULATE is unchanged: five consecutive fiscal years of ROIC above 15% across automotive and energy/AI segments, with the latter contributing over 30% of revenue and gross margins proving pricing power above inflation, all while share count remains flat. Given the current 4.8% ROIC, 50% SBC drag, and management’s evasiveness, that scenario is so remote it isn’t worth underwriting. No price decline — no matter how severe — substitutes for a durable barrier to entry. I will not own a commoditizing auto manufacturer dressed in narrative, regardless of the discount to an inflated market price.
Jim Chanos — Rebuttal
Where the others sharpened my view
Klarman’s arithmetic correction — that true after‑SBC owner earnings shrink the DCF base case from $55.73 to potentially $10‑$12 per share — sharpens the forced‑sale narrative I’m betting on. His note that the reported FCF is a mirage and that the balance‑sheet cash is partly encumbered by an “investment‑grade spending appetite” gives the downside an insolvency tail my own work underweighted. Buffett’s dissection of the two‑year ROIC spike as a “temporary windfall
Catalysts to watch
Specific upcoming events that could change this thesis. When the date arrives, re-run the analysis to surface what moved.
| Date | Title | Tests | Category |
|---|---|---|---|
| 2026-07-31 | Q2 2026 earnings release | Revenue growth trajectory and operating margin erosion (key thesis inputs) | earnings |
| 2026-10-31 | Q3 2026 earnings release | Revenue CAGR, operating margin, ROIC trajectory (moat erosion signal) | earnings |
| 2027-01-31 | Q4 2026 / FY2026 earnings release | Full-year revenue growth, operating margin, and ROIC (moat persistence) | earnings |
| unknown | Tornetta v. Musk final judgment | Share-count dilution and potential catch-up compensation expense (kill criterion for valuation) | legal |
Detail
- Q2 2026 earnings release (2026-07-31) — First full quarter after Q1 2026 revenue bounce (+15.8% YoY off depressed base). Tests whether top-line and margin trends stabilize or continue structural decline.
- Source:
[er]
- Source:
- Q3 2026 earnings release (2026-10-31) — Peak-season quarter. Tests whether automotive revenue can halt year-over-year declines and whether operating margin can stabilize above 4%.
- Source:
[er]
- Source:
- Q4 2026 / FY2026 earnings release (2027-01-31) — Full-year FY2026 results. Critical to see if FY2025 revenue contraction (-2.9%) deepens or reverses, and if ROIC remains below cost of capital.
- Source:
[er]
- Source:
- Tornetta v. Musk final judgment (unknown) — Delaware Chancery Court ruling on the validity of the 2018 CEO Performance Award. If voided, the 2025 Interim Award may be triggered; if upheld, extreme dilution from outstanding options could materialize.
- Source:
[er]
- Source:
Conditional Buy Thesis
The verdict is Avoid today — but every Avoid thesis still has a conditional buy target to watch if the situation improves. Below: what price + what events would flip this to a Buy.
What price would change my mind?
Below $32 per share — a –92.5% decline from $428.96. This is the bear‑case DCF intrinsic value of $45.58 less a 30% margin of safety. At that level, even the most punitive after‑SBC earnings yield begins to approach a double‑digit return on tangible capital, assuming the core business survives. It also equates to roughly 0.6× the after‑SBC true FCF run‑rate of $3,395 M on a no‑growth basis, a threshold where a liquidation or take‑private analysis starts to make sense. Below $32, the price would no longer be purely a narrative premium; it would begin to reflect the residual value of the automotive and energy assets on a stressed‑balance‑sheet basis.
What observable events would change my mind?
- Two consecutive quarters of automotive revenue stabilization (YoY growth ≥0% in Americas and global deliveries flat or up) — Currently, revenue contracted –2.9% in FY2025 and peak‑quarter revenue is declining. A durable halt to the topline slide would suggest the price‑war floor has been reached.
- Operating margin recovers above 8% for two quarters — From the current 4.6%, a move to 8%+ would signal genuine cost‑cutting traction or a mix shift away from price‑cut dependency, restoring economic spreads above the cost of capital.
- FCF after SBC turns positive and exceeds $1 per share per quarter for four consecutive quarters — This would demonstrate true owner‑earnings generation, not just a capex‑cut mirage. It would also imply that the 50.2% SBC drag has moderated.
- The $23.7 B CEO Interim Award is fully expensed without a catastrophic earnings shock, and no further material equity awards are announced for 12 months — This removes the single largest hidden liability. If recognized in a single quarter and absorbed with net income remaining positive, it clears a major overhang.
- Management provides forward guidance on automotive segment profitability and meets or exceeds it for two full fiscal years — This would constitute a break from the evasive pattern and rebuild credibility on the core operating metrics that drive value, not just AI narratives.
My bottom line
I would flip to ACCUMULATE only if the price falls below $32 and at least three of the five events above occur — specifically, automotive margins >8% and FCF after SBC turning sustainably positive. Below $32, the risk/reward shifts from “permanent capital loss” to “deeply distressed asset”; with operational proof, conviction could be built. Until then, the stock is a structural pass — overpriced for a business whose returns on capital have collapsed to the risk‑free rate and whose management systematically dilutes shareholders while pivoting narratives. No price above bear‑case IV minus MoS can justify the uncertainty.
What each investor would say
Four lenses on the same business.
Chanos
The Bear · high short convictionWhat I agree with
The thesis correctly surfaces the structural decay in Tesla’s core financials. ROIC collapsing from 36.6% to 4.8% over four years—barely above the 4.57% risk‑free rate—is a textbook moat‑erosion signal, and the median ROIC of –1.84% over a decade confirms the two high‑return years were an anomaly, not a franchise. The capital‑allocation grade of D is spot‑on: zero buybacks or dividends, shares outstanding up +30.3% in five years, and SBC averaging 50.2% of reported FCF—shareholders have been diluted while management and the board hoard liquidity. The FY2025 FCF illusion ($6,220 M headline, $3,395 M after SBC) entirely driven by a $2,815 M capex cut is exactly the kind of cash‑flow mirage I hunt, and management’s credibility analysis—7 broken promises on profitability and volume, evasive AI pivots—destroys any reason to trust forward guidance.
What I’d push back on
The thesis’s “quality of earnings” verdict of STRONG is dangerously misleading. Observing that OCF exceeded NI in seven of eight quarters misses the entire point: stock‑based compensation is a real dilution cost, not a free form of employee payment. After deducting SBC, true free cash flow available to equity holders in FY2025 was only $3,395 M [pc]—a 2.1% yield on the current price. The share count has risen +30.3% in five years, and the $23.7 B CEO Interim Award will push that far higher. Calling earnings high‑quality while ignoring a 50% FCF haircut from dilution is forensic blindness.
The single most compelling reason this stock could be down 50% three years from now is an earnings shock from the $8,607 M warranty reserve, combined with the sudden recognition of the deferred CEO compensation expense. The auditor’s critical audit matter notes the warranty reserve requires “especially challenging, subjective, or complex judgments.” A 20% adverse development—$1.7 B—would wipe out 39% of FY2025’s already‑thin operating income, and with an aging fleet (Model 3/Y now five years on the road), claims severity could easily force a top‑up. Meanwhile, the $23.7 B Interim Award’s expense hasn’t been booked; when the performance condition becomes “probable,” a multi‑billion‑dollar charge will devastate a single quarter’s earnings—and that charge is inevitable within 2–3 years. If that quarter also sees tariff‑compressed energy margins and continued auto revenue declines, Tesla could report a quarterly loss exceeding $5 B, exposing the absurd 420× earnings multiple and forcing a re‑rating toward single‑digit auto multiples. The thesis nods at these risks but underweights the compounding effect of simultaneous accounting hits.
I’d reverse my view if, over the next four quarters, Tesla’s core automotive gross margin ex‑regulatory credits stabilizes above 15% for two consecutive quarters, FSD subscription revenue reaches a $2 B annual run‑rate with high renewal rates, and the company conducts meaningful share repurchases rather than issuing hundreds of millions in new equity.
My bottom line
SHORT_HIGH_CONVICTION. The DCF intrinsic value of $55.73 against a $428.96 price is not a valuation divergence—it’s a chasm. ROIC has collapsed to 4.8%, management credibility is D‑grade and evasive, and the coming convergence of a warranty reserve blowup with the $23.7 B deferred comp charge will expose the true, single‑digit billion true FCF reality under a $1.61 T market cap. I’d short with size and use puts to capture the inevitable mean‑reversion toward auto‑cyclical multiples.
Buffett
What I agree with
The thesis gets the central fact of the case exactly right: the numbers have turned decisively against this business. Operating margin has contracted from 16.8% to 4.6% over three years, and ROIC has collapsed from 36.6% to 4.8% — now barely above the 4.57% risk‑free rate. When a capital‑intensive manufacturer begins earning returns that fail to clear its cost of capital, the economic engine is broken. The thesis correctly identifies that the FCF surge in 2025 ($6,220M) was a mirage — achieved by slashing capex 24.8% — not a sign of improving quality. I also agree that stock‑based compensation, which has averaged 50.2% of reported FCF, makes the headline free cash flow deeply misleading. True owner earnings after dilution are a fraction of the reported figure. The management credibility grade of D is well‑supported by the breakdown of 7 broken promises versus 7 kept, with the kept ones clustered around product launches and the broken ones squarely in the core metrics of profitability and volume growth. The pattern of setting aggressive near‑term targets — Austin safety‑driver removal, Cybercab production start — missing them without acknowledgment, and pivoting to new visions, is exactly the kind of evasive habit that destroys shareholder trust. The thesis’s final warning that the $23.7 billion CEO interim award will inflict a sudden earnings charge when the performance condition becomes probable is an important and under‑appreciated risk.
What I’d push back on
The thesis declares a verdict of “Pass” with moderate conviction and a quality score of 5/10. Given its own analysis, that conclusion is too generous. The intrinsic value range is $46‑$60, and the stock is at $429. Even the most optimistic sensitivity — 10% growth and a 4‑point margin lift — yields only $53 per share. The margin of safety is –670%. A business whose returns on tangible capital have fallen below the risk‑free rate, whose revenue is shrinking, and whose management systematically over‑promises and dilutes shareholders, is not a “5/10” quality business in my book. It is a sub‑par business with a speculative stock price. The gap between price and value here is so vast that no rational investor would consider it “on the watchlist” at current levels. If the thesis truly believes the business is deteriorating and the moat is eroding, the only logical verdict is “Avoid.” The “Pass” may be unintentional charity toward the narrative of optionality in AI and robotics, but the thesis itself correctly labels those as outside the circle of competence and unsupported by disclosed revenue. When you have a business whose current economics are weak and whose forward promises are unverifiable, at a price that implies 50%+ growth, you don’t pass—you walk away.
Additionally, the thesis frames the moat as having “existed for roughly two years.” I’d argue that even that is misleading. The two years of high ROIC (2021 and 2022) coincided with a unique period: pandemic‑era supply constraints limited competition, and Tesla enjoyed a pricing umbrella that inflated margins. The median 10‑year ROIC is –1.84%. A two‑year spike amidst a decade of capital‑destroying returns is not a moat; it’s a temporary windfall. The business never developed durable pricing power or competitive insulation. The so‑called “moat erosion” is really just the unwinding of a favorable but unsustainable market anomaly.
I’d reverse my view if Tesla achieves a trailing twelve‑month operating margin above 10% and an ROIC above 15% over two consecutive fiscal years, with no decline in unit deliveries, and with management explicitly tying forward guidance to audited automotive profitability rather than to AI or robotics narratives. That would be the first evidence of a genuine, defensible franchise.
My bottom line
AVOID. The current price embeds a fantasy of uninterrupted growth that the financial statements actively contradict. The core automotive operation is generating returns below its cost of capital, management has a track record of broken promises and shareholder dilution, and the balance‑sheet strength is being squandered on massive equity awards rather than returned to owners. At a price‑to‑owner‑earnings multiple that is off the scale relative to the business’s deteriorating fundamentals, this is not a stock I’d buy at any price near $429.
Hohn
What I agree with
The thesis correctly identifies that Tesla lacks the durable barriers to entry that define a structurally good business. ROIC has collapsed from 36.6% in FY2022 to 4.8% in FY2025—barely above the 4.57% risk‑free rate—and the 10‑year average ROIC is –10.8%. Only two years out of the last ten produced returns above 15%. That trajectory is precisely what you would expect when a first‑mover advantage in a capital‑intensive, commoditising industry is competed away. The cash conversion cycle reversal from –26 days (supplier financing) to +13 days, and the operating margin compression from 16.8% to 4.6%, confirm the loss of any pricing‑power or structural cost advantage. The capital allocation record is also damning: +30.3% share dilution over five years, stock‑based compensation consuming 50.2% of reported free cash flow, zero buybacks, and a $23.7 billion CEO award that will further dilute outside shareholders. These are not the markings of a compounding machine; they are the marks of a business where the economic returns accrue to insiders, not shareholders.
What I’d push back on
The thesis rates Tesla’s quality as 5/10 and its verdict as a “Pass.” That understates the severity of the moat failure. The energy‑storage business is genuinely growing (46.7 GWh deployed, +49%), but it is tariff‑exposed, lacks a disclosed ROIC above the cost of capital, and has no evidence of network effects, switching costs, or IP complexity that would sustain returns above 15% independently. The AI narratives—Robotaxi, FSD, Optimus—are revenue‑less and rest on a management track record that has repeatedly missed self‑imposed deadlines. In an 8‑plus‑year hold framework, a business that earns 4.8% on tangible capital today and has a ten‑year median ROIC of –1.84% does not belong on a watchlist; it belongs on the anti‑list. The auto‑manufacturing sector is structurally bad, and Tesla offers no exceptional moat that justifies an exception—its high‑ROIC period was a fleeting supply‑demand anomaly, not a sustainably wide barrier. I’d reverse my view if Tesla demonstrates a five‑consecutive‑year ROIC above 15% across all segments, with energy/AI generating over 30% of revenue and margins that prove pricing power disconnected from subsidies, but the next decade’s competitive dynamics give no basis to expect that.
My bottom line
AVOID. Auto manufacturing is on my structural anti‑list, and Tesla’s financials—4.8% ROIC, operating margin slumping to 4.6%, and negative economic spread—confirm the moat never became durable. The dilution cascade (+30% share count) and the management’s evasiveness on core profitability goals disqualify any sleep‑at‑night conviction. No exceptional barrier to entry exists that would lift this business out of the commodity trap.
Klarman
What I agree with
The core warning is correct: the downside here is not hypothetical — it's arithmetic. The DCF base case yields $55.73 per share against a price of $428.96, a margin of safety of –669.8% [pc]. The reverse‑DCF implied growth of +50.0% means the market is pricing in a trajectory that no reasonable framework can support. That alone puts this in the “impossible to underwrite” category. I agree with the granular breakdown: ROIC has collapsed from 36.6% to 4.8% over four years [pc] — a figure that barely clears the risk‑free rate of 4.57% — and the median ROIC over the full cycle is –1.84% [pc]. The moat erosion signal is real and supported. I also concur that management’s credibility is beyond salvage: a D grade, an evasive pattern across three transitions, and 7 broken promises against 7 kept [cred]. The stock‑based compensation reality — 50.2% of reported FCF on average [pc], diluting shareholders by +30.3% over five years [pc] — means true owner earnings are a fraction of the headline FCF. The $8,607M warranty reserve flagged by the auditor [10K‑FS‑2026‑p1] is a live wire: a 20% adverse development equals 39% of FY2025 operating income. The thesis correctly identifies that the market is buying a narrative (Robotaxi, FSD, Optimus) that has no material revenue while the core auto business — $94.8B in revenue, $4.4B in operating income — is shrinking and structurally compressing. These are not opinions; they are the financial statements.
What I’d push back on
The thesis’s DCF base case of $55.73 [pc] is almost certainly too generous, because it appears to rely on reported FCF rather than true after‑SBC owner earnings. Once you deduct SBC from FCF — and the thesis itself shows true FCF after SBC was only $3,395M in FY2025 [pc], not $6,220M — the intrinsic value would be substantially lower. Using a basic perpetuity of that adjusted FCF at a 10% discount produces a value closer to $34B total, or roughly $10‑$12 per share, not $55. The IV estimates provided may therefore understate the actual downside. Furthermore, the stress‑case scenarios ($43.61 plain recession, $17.54 2008‑style, $18.99 stagflation) all assume that the business survives as a going concern with some revenue base. But we must ask: in a consumer recession that chokes auto lending and forces further price cuts, could the core business burn cash? The balance sheet has $16.5B of cash and $6.6B of debt, but that cash is not truly surplus if the company must continue funding capex (they guided to “exceed $20B” [er]) and potential warranty settlements. The “fortress” liquidity is partly encumbered by the investment‑grade spending appetite and by the reality that much of it may be needed to absorb operating losses if automotive margins slip below breakeven. A more severe downside — not a 2008 credit‑event replay, but a demand‑cycle shock specific to Tesla’s aging product line and tariff‑exposed energy segment — could wipe out equity value entirely. Finally, the deferred $23.7B CEO award is an earnings bomb that hardly damages cash flow directly, but the reputational and multiple‑compression fallout when that charge hits the income statement is not priced into the DCF. The market could re‑rate the stock from “AI visionary” to “SBC‑riddled auto manufacturer” overnight.
I’d reverse my view if, in the next four consecutive quarters, Tesla reports (a) FCF after SBC exceeding $1 per share per quarter, (b) ROIC rising above 12%, and (c) automotive revenue growth turning positive with operating margins above 10%, all while dilution remains below 5% annualized.
My bottom line
AVOID — The margin of safety is not just negative; it’s fundamentally indeterminate because the intrinsic value after adjusting for true owner earnings is plausibly below $20 per share, compared to a price of $429. Permanent capital loss risk is severe. The business is a low‑return auto manufacturer dressed in AI‑narrative premium, with a management team that has systematically diluted shareholders while delivering declining profitability. There is no price at which I would underwrite an investment here.
Kill criteria
If any of these triggers, the thesis is dead — exit, don't average down.
- Robotaxi service generates significant revenue and profits
- FSD achieves demonstrable unsupervised capability
- Core auto margins recover to >15%
- ROIC returns above 15% sustainably
- Stock price drops below $100 providing adequate margin of safety
Macro calibration
Elevated macro valuations (CAPE 42, Buffett indicator 229.6%) and rising rates compress terminal multiples, making the required growth for TSLA even more unrealistic.
More sample theses
Browse the full sample library.
Now run your own.
Type a US ticker. Thirty minutes later, you receive the same kind of thesis we just showed you for TSLA — fact-checked, kill-criteria named, intrinsic value triangulated.
First thesis free · no card required