Want one of these for the company you're actually watching?
Free first thesis. No card. Thirty minutes from ticker to inbox.
At what price would the agents act?
Full thesis
NVIDIA CORP (NVDA) - Investment Thesis
May 26, 2026
Summary
| Metric | Value |
|---|---|
| Verdict | Watchlist · moderate conviction · Quality 8/10 |
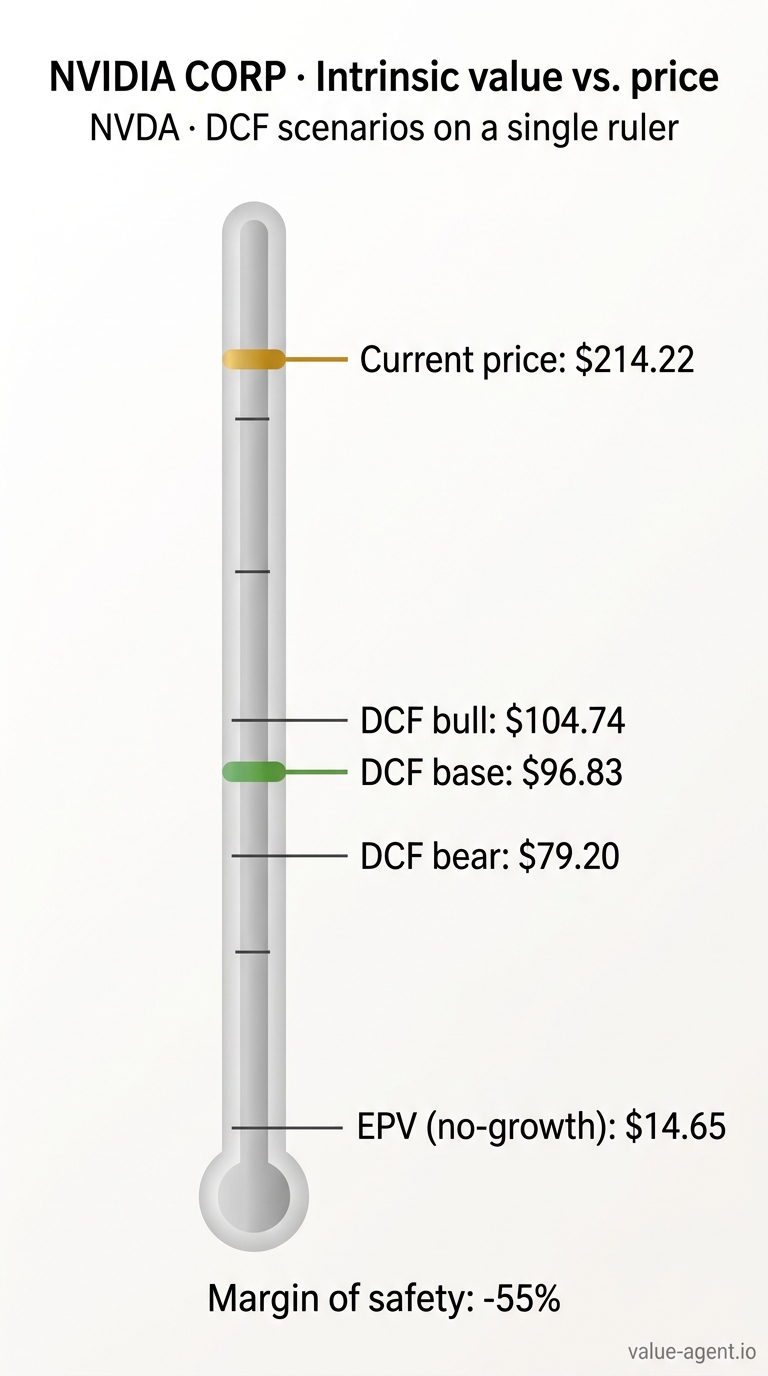
| Current price | $214.22 |
| IV (DCF Bear / Base / Bull) | $79.20 / $96.83 / $104.74 |
| IV (EPV) | $14.65 |
| Margin of Safety @ Base | price is 2.2× intrinsic value |
| Reverse-DCF implied growth | +36.5% |
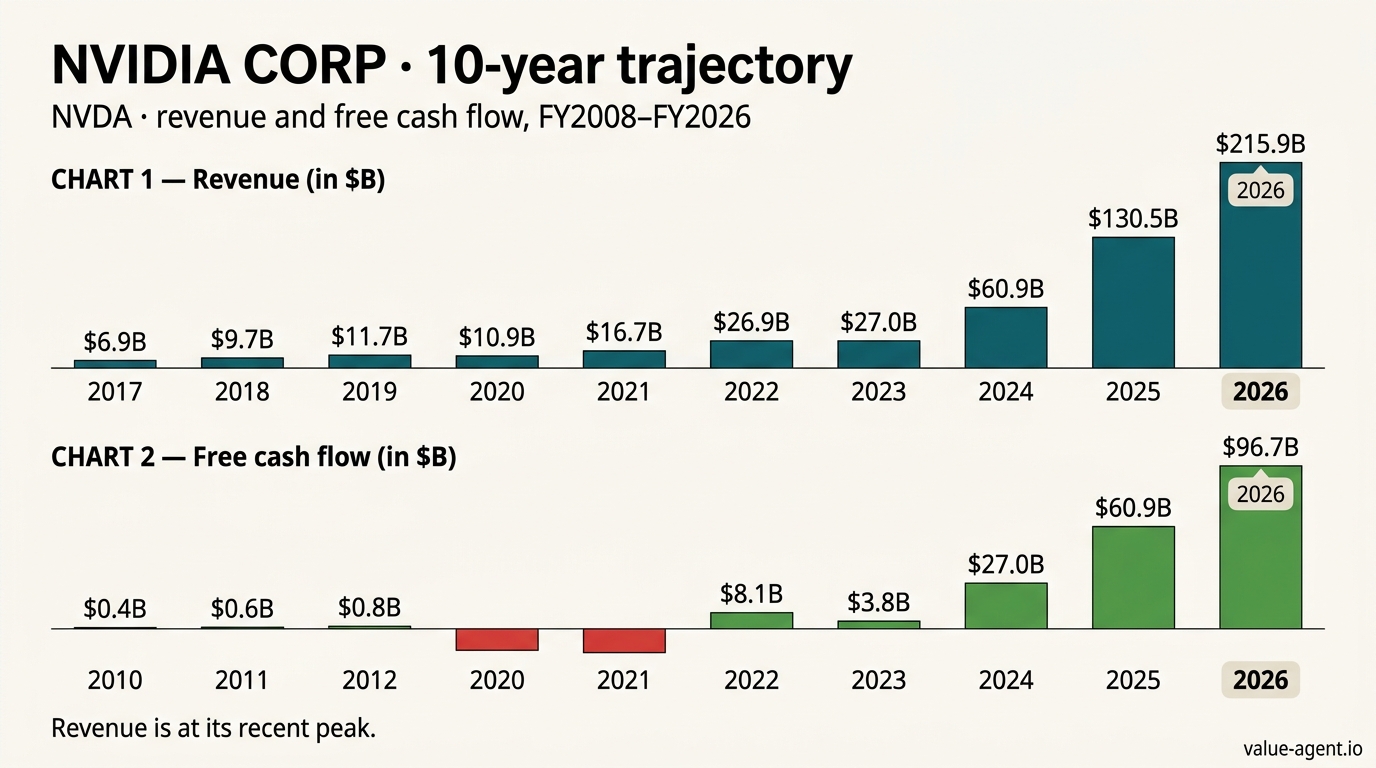
| Latest FCF | $96.7B |
| FCF 5yr CAGR | +41.2% |
| Revenue 5yr CAGR | +66.9% |
| Latest ROIC | 54.3% |
| ROIC 10yr avg | 32.7% |
| Macro | CAPE 42.0 · 10Y 4.57% · Buffett indicator 229.6% |
| Management Credibility | B |
(Fill: from verdict object: Verdict = Watchlist, Conviction = moderate, Quality = 8/10. Margin of Safety from verdict: -121.2% (IV‑based), so price is 2.2× IV. Other fields from [pc], [dp], [cred], [macro].)
The Business in One Paragraph
NVIDIA is the world's leading accelerated‑computing platform company. It designs GPUs, networking hardware, and the CUDA software ecosystem that dominates AI training and inference, high‑performance computing, and professional visualization. Revenue is overwhelmingly driven by the Compute & Networking segment, where hyperscale cloud providers and enterprises buy data‑center systems to power generative AI. The business model is fabless - manufacturing is outsourced - but increasingly capital‑intensive as long‑term supply commitments and annual architecture cycles demand massive prepayments and infrastructure investments. NVIDIA generates owner earnings of $120 billion on $215.9 billion of revenue [dp], with operating margins that surpassed 60% during the AI build‑out [pc]. Its competitive moat, built on two decades of R&D and millions of CUDA‑trained developers, is genuine, but it operates in a cyclical semiconductor market and faces escalating geopolitical restrictions that have already triggered a multi‑billion‑dollar write‑down. (The business is understandable within our circle of competence: its long history, dominant market position, and predictable cash‑flow profile make fundamental analysis feasible.)
Financial Analyst Deep Dive
(Verbatim from the Financial Analyst Report)
Financial Analyst Report: NVIDIA Corp (NVDA)
Date: May 26, 2026 | Price: $214.22 | Market Cap: ~$5.19T | DCF Base IV: $96.83 | Margin of Safety: -121.2%
The 10-Year Story in One Paragraph
NVIDIA has delivered the single greatest financial transformation in modern corporate history - revenue compounding at 45.7% annually over a decade [pc], operating margins expanding from 28.0% to 60.4% [pc], and ROIC averaging 32.7% with eight years above 20% [pc]. But the market has priced this business as though the past three years of AI-fueled hypergrowth are a permanent new steady state. They are not. Revenue growth is decelerating sharply: 125.9% → 114.2% → 65.5% → and the latest quarter printed -10.5% YoY [pc]. Operating margin has already begun to compress (62.4% → 60.4%) [pc]. ROIC collapsed 27 percentage points in a single year (81.2% → 54.3%) [pc] as the business got more capital-intensive. The reverse-DCF implies 36.5% sustained growth [pc] - a rate that already exceeds what the most recent fiscal year delivered (65.5% and falling). At $214.22 against a base-case intrinsic value of $96.83 [pc], the market is pricing perfection into a business where the cracks - geopolitical write-downs, working capital deterioration, a $17.5B venture splurge, and forensic accrual flags - are already visible in the numbers.
Top-Line Trajectory
NVIDIA's revenue has been a story of three distinct eras. The pre-AI era (FY2017-FY2022): revenue grew from $6,910M to $26,914M - impressive at a 31.3% CAGR but recognizable as a cyclical semiconductor growth story, complete with a crypto-driven boom and the FY2023 hangover (revenue flat at $26,974M, +0.2%) [dp]. Then the AI era ignited. FY2024: $60,922M (+125.9%). FY2025: $130,497M (+114.2%). FY2026: $215,938M (+65.5%) [dp] [pc].
The inflection is unmistakable but the deceleration is equally clear. The 3-year revenue CAGR sits at 100.0% [pc] - a number that captures FY2024-FY2026, where the base effect of the flat FY2023 year flatters the math. The 5-year CAGR is 66.9% [pc]. Both will compress mechanically as the FY2023 trough rotates out of the window. The latest quarter printed -10.5% YoY, 77.4 percentage points below the 5-year CAGR [pc]. That is not noise; it is the loudest signal in the dataset that the law of large numbers has arrived.
The quarterly trajectory confirms lumpiness, not smooth compounding. Revenue swung from $91.2B (Oct 2024) to $44.1B (Apr 2025, depressed by the H20 charge), then to $147.8B (Oct 2025, the Blackwell peak), then to $81.6B (Apr 2026) - a 45% sequential drop, the largest in the series [quarterly]. Management attributes this to product transition dynamics and the one-year architecture cadence [10k-mda-2026-p1]. That is credible as an explanation but damning as an investment attribute: a business with 45% intra-year revenue swings is not one whose terminal growth rate should be extrapolated from peak quarters.
Profitability Evolution
Operating margin averaged 24.9% over the full decade but the slope tells the real story: +2.76 percentage points per year [pc]. The business structurally re-rated from a ~28-33% margin profile (FY2017-FY2019) to a 54-62% profile in the AI era (FY2024-FY2026). FY2025's 62.4% operating margin represents the likely zenith - pricing power at its absolute maximum, with Hopper architecture commanding scarcity premiums and hyperscalers racing to build out AI capacity at any cost.
FY2026 saw the first compression in three years: 60.4%, down 200 basis points [pc]. The MD&A attributes this to the $4.5B H20 inventory charge - but that only explains roughly 210bp of the decline (the charge represented about 2.1% of revenue). The rest is structural: capex nearly doubled to $6,042M [dp], R&D spending is accelerating, and the "one-year product cadence" means amortization and transition costs are becoming recurring rather than episodic. Management's own language has shifted: "The complexity of our product transitions and sophisticated system configurations has and may in the future cause delays in production and create challenges in managing supply and demand" [10k-mda-2026-p1]. When a company earning 60% operating margins spends this many words on complexity and potential revenue volatility, it is signaling that the margin structure has passed its inflection point.
The Apr 2026 quarter printed a 71.5% net income margin - an aberration driven by one-time mix effects or prior-period reversals [quarterly]. Adjacent quarters ran 50-55%. Mean reversion from that outlier alone implies a ~$13B quarterly net income headwind.
Returns on Capital
ROIC is the single best lens on whether NVIDIA's moat is widening or narrowing. The 10-year average is 32.7%, the median is 23.9%, and the standard deviation is a massive 24.1 percentage points [pc]. That standard deviation is not a footnote - it is the thesis. This is a wildly cyclical return profile dressed in secular-growth clothing.
The trajectory: ROIC oscillated between 11.2% and 68.2% in the pre-AI years. Then FY2024 hit 57.4%, FY2025 peaked at 81.2%, and FY2026 plunged to 54.3% [pc]. That 27-point drop in a single year is the largest inflection signal in the dataset. It reflects the $17.5B deployed into private companies and infrastructure funds - capital that sits on the balance sheet earning zero or uncertain returns versus the operating business that generates 50%+ ROIC. Management acknowledges these are "illiquid and non-marketable" and that "there can be no assurance that we will realize a return" [10k-mda-2026-p1]. This is not a temporary working-capital build; it is a deliberate capital allocation decision that permanently dilutes consolidated ROIC.
The moat is real. CUDA's developer ecosystem, the architectural lead, and the systems-level integration (networking, software, hardware co-design) create switching costs that are genuinely formidable. But moats are revealed by sustained high ROIC in the absence of demand explosions. NVIDIA has never been tested in a normal-demand environment at its current scale. The FY2023 episode - ROIC crashing to 11.2% on flat revenue - suggests that when the demand music stops, the return profile reverts violently.
Cash Flow Quality
Reported free cash flow in FY2026 was $96,676M [dp]. That is a fortress-level number. But the quality of that cash generation is deteriorating on three dimensions.
First, FCF/NI conversion. The 10-year average is 1.12x, meaning cash flow historically exceeded net income [pc]. But the median is only 0.87x [pc], and the recent trend is below that median: FY2026 FCF of $96,676M against net income of $120,067M yields an 0.81x conversion ratio. Over the last four quarters, net income exceeded operating cash flow by a cumulative $34.1B [quarterly]. Accruals are doing the heavy lifting.
Second, the Sloan accruals ratio stands at +10.9%, above the 10% danger threshold [pc]. The 3-year average is +8.0%. This is not a one-quarter artifact. The Beneish M-Score of -1.06 exceeds the -1.78 threshold for "likely manipulator" [pc]. I will address this directly: the elevated M-Score is partially driven by the Sales Growth Index (SGI = 1.655) and Asset Quality Index (AQI = 1.517), which are mechanically inflated by hypergrowth and the $17.5B investment deployment, not by fraudulent accounting. The Sloan accruals ratio, however, is harder to dismiss - it measures the gap between accrual-based earnings and cash earnings, and it is flashing red because receivables and inventory are building faster than payables. The cash conversion cycle has risen from 95 days in FY2022 to 133 days in FY2026, climbing at 5.5 days per year [pc]. Working capital is consuming cash, not releasing it.
Third, stock-based compensation. SBC averages 23.1% of reported FCF [pc]. True FCF after SBC was $90,290M in FY2026 - still enormous, but $6.4B lower than the headline number [pc]. This is not a dilution crisis (the 5-year net share count change is -2.33%, meaning modest buybacks) [pc], but it means roughly a sixth of reported free cash flow is being quietly transferred from shareholders to employees before it ever reaches the treasury.
Capital Allocation Grade (A-F)
Grade: C+
The case for a higher grade: NVIDIA has reduced shares outstanding by 2.33% over five years [pc], paid down total debt from $10,946M to $7,470M [dp], and now carries a Debt/Equity ratio of just 3.8% [pc] - a fortress balance sheet. Dividends have been raised 150% and total $5,385M cumulatively [pc]. The Arm acquisition was terminated rather than pursued into an existential regulatory fight, which preserved capital.
The case against: the $17.5B deployed into private startups and infrastructure funds in FY2026 [10k-mda-2026-p1] is the single largest capital allocation decision in the company's history outside of the failed Arm deal, and it comes with no track record, no liquidity, and management's own warning about return uncertainty. This is not Berkshire Hathaway deploying float into public equities with deep analysis; this is a semiconductor company crossing into venture capital at the peak of an AI hype cycle. The investments may include "AI model makers that purchase our products directly or through CSPs" [10k-mda-2026-p1] - language that hints at circular financing: NVIDIA invests in startups, which use the capital to buy NVIDIA GPUs, which generates NVIDIA revenue. If that structure exists at any material scale, it inflates reported revenue with capital that ultimately came from NVIDIA's own balance sheet. I cannot quantify this from the available data, but the disclosure is sufficiently suggestive to warrant deep skepticism.
Additionally, executive compensation is tied to a mix of metrics: CEO equity vests based on Non‑GAAP Operating Income and three‑year TSR, while cash bonuses for other NEOs are tied to revenue; however, the absence of margin or return metrics remains a concern [er]. A C-suite compensated exclusively on top-line growth, in a business that just deployed $17.5B into illiquid venture investments, is an incentive structure designed to maximize size, not per-share value.
The capex/D&A ratio averages 1.50x [pc], indicating the company is investing above maintenance levels - appropriate for growth, but the FY2026 ratio likely exceeds 2.0x given the capex doubling. This is no longer a capital-light fabless model; it is becoming capital-intensive.
Total: Fortress balance sheet, disciplined buybacks, but the venture splurge and single-metric compensation pull the grade down to C+.
Balance Sheet Strength
The balance sheet is the strongest part of the NVIDIA story – and the part most at risk from the venture allocation. Total debt of $7,470M against cash of $13,237M yields a strong net cash position [dp]. Debt/Equity is 3.8% [pc], down from 49.6% three years ago [pc]. The company could pay off all outstanding debt tomorrow with a third of its cash balance. Total equity has swollen to $195,474M [dp], up 146% from $79,327M the prior year, driven by retained earnings.
The risk is not solvency but capital misallocation. The $17.5B in private investments - if marked down in a downturn - would represent roughly 9% of total equity. That is survivable but not trivial, especially if combined with another inventory charge (the FY2023 $2.17B and FY2026 $4.5B precedents suggest this is a recurring feature, not a bug). The cash conversion cycle stretching to 133 days [pc] means that even the fortress balance sheet is gradually being consumed by working capital - $16.1B absorbed cumulatively over the last two reported quarters [quarterly].
Red Flags & Accounting Concerns
Red Flag 1: Share-count dilution of +100,908.4% over the full period [pc].
This is a data artifact from the 4-for-1 (2021) and 10-for-1 (2024) stock splits. The 5-year net change of -2.33% and 10-year of +7.71% [pc] are the economically meaningful figures. The full-period number captures the pre-split share counts without adjustment. Discounted. NVIDIA has been a net repurchaser of shares in recent years.
Red Flag 2: Cash conversion cycle increasing at +5.5 days/year [pc].
This is real and concerning. CCC has moved from 95 days (FY2022) → 176 days (FY2023, the inventory glut) → 117 days (FY2024) → 107 days (FY2025) → 133 days (FY2026) [pc]. The FY2026 reversal - CCC widening by 26 days - coincides with the $4.5B H20 charge and the broader inventory build for Blackwell/Rubin transitions. If demand slows, those 125 days of inventory [pc] become write-down candidates. Sustained.
Red Flag 3: Latest quarter YoY -10.5%, 77.4pp below 5-year CAGR [pc].
This is the most optically alarming signal, but it requires context. The Apr quarter is historically NVIDIA's trough, following the holiday/calendar-year-end surge. Apr 2024 was $26.0B; Apr 2025 was $44.1B; Apr 2026 was $81.6B [quarterly]. The -10.5% YoY compares against the Apr 2025 quarter that was depressed by the H20 charge, not against a clean base. On a two-year stack, Apr 2026 is up roughly 85% from Apr 2024. Partially discounted - the YoY optics are misleading, but the sequential 45% drop from Oct 2025 to Apr 2026 is the real signal of demand lumpiness.
Red Flag 4: Beneish M-Score -1.06 > -1.78 [pc].
As discussed above, the elevated score is driven by hypergrowth metrics (SGI, AQI) that are genuine rather than fabricated. The TATA (total accruals to total assets) of 0.084 is moderately elevated but not extreme. I would not treat this as a manipulation signal in isolation; paired with the Sloan ratio, it reinforces the earnings-quality concern. Partially discounted.
Red Flag 5: Sloan accruals ratio +10.9% [pc].
This is the red flag that matters most. A ratio above 10% indicates that more than 10% of reported earnings are not backed by cash flows. Combined with four consecutive quarters of NI > OCF (gap averaging $8.4B) [quarterly], this signals that reported profitability overstates economic profitability. Receivables at 65 days [pc] and inventory at 125 days [pc] are both elevated relative to historical norms. Sustained and escalated.
Additional Flag: Circular financing risk. The $17.5B venture portfolio includes "AI model makers that purchase our products directly or through CSPs" [10k-mda-2026-p1]. This creates the possibility that NVIDIA's revenue includes purchases funded by NVIDIA's own investment capital. Without segment-level disclosure on this point, the magnitude is unknowable, but the structure exists and demands monitoring.
Management's Track Record
The Management Credibility Report assigns a grade of B, with a record of 10 kept promises, 1 partial, 3 broken, and 1 unverifiable across four transition years [cred]. That is a strong batting average, and it reflects genuine execution prowess: the Hopper ramp, the Blackwell launch, the one-year product cadence, and the Arm termination charge were all delivered as promised.
But the three broken promises share a common thread: demand forecasting. In FY2022, management promised to "remain supply-constrained into the first half of fiscal year 2023" - the opposite happened, resulting in a $2.17B charge [cred]. In FY2026, the implicit assurance that alternative products and compliance would manage China export risks was shattered by the sudden H20 license requirement, triggering a $4.5B charge and reducing H20 revenue to just $60M [cred]. These are not trivial misses; they are multi-billion-dollar errors rooted in overconfidence about factors management cannot control - crypto demand, geopolitical decisions.
The tone assessment of "HONEST_AND_CONFIDENT" [cred] is fair. Management does not evade hard questions, provides numerically precise guidance, and acknowledges constraints (China, input costs) directly. But the pattern of large, episodic write-downs - recurring every 2-3 years - suggests the confidence systematically overshoots the reality when external shocks hit. At a $5.19T market cap, the cost of the next forecasting error is measured in hundreds of billions of shareholder value, not billions of inventory provisions.
The compensation plan, which links CEO equity to operating income and TSR but uses a revenue metric for other NEOs’ cash bonuses [er], reinforces the incentive to prioritize growth. When executive bonuses are tied exclusively to revenue, and the biggest historical misses are demand-related, the incentive structure is misaligned with what actually drives per-share value creation: return on invested capital.
What the Numbers Tell Us About the Business
NVIDIA is not a traditional compounder. A compounder - the kind Buffett buys and holds forever - delivers predictable, above-average returns on capital with modest variability. NVIDIA's ROIC has a standard deviation of 24.1 percentage points [pc]. It has swung from 11.2% to 81.2% in three years and back to 54.3% [pc]. That is not predictability; that is a business whose returns are overwhelmingly determined by the position of the demand cycle relative to its supply commitments.
What NVIDIA actually is: a cyclical infrastructure monopolist riding the largest demand wave in technology history. The monopoly position is genuine - CUDA lock-in, architectural leadership, systems integration - but it does not insulate the business from demand cycles, as FY2023 proved. When demand softens, the same long-lead-time supply chain that enables the feast becomes the mechanism for the famine. Inventory provisions are not a bug; they are a structural feature of a business that must commit to supply 12+ months before knowing demand.
At $214.22 per share, the market is valuing this cyclical infrastructure monopolist as though its current demand wave is permanent. The DCF base case IV is $96.83 [pc]. The stress tests are sobering: in a 2020-replay scenario, IV drops to $76.57 (margin of safety -179.8%); in a stagflation scenario, $33.00 (-549.2%); in a 2008-replay, $30.48 (-602.9%) [pc]. The sensitivity grid shows that even with +10% growth and +4pp margin expansion, IV reaches only $92 [pc] - still less than half the current price. The reverse-DCF implies 36.5% growth [pc], a rate that exceeds the most recent fiscal year's already-decelerating 65.5% once the base effects normalize.
The bull case for NVIDIA is not that the business is overvalued on DCF; it is that DCF is the wrong tool for a company potentially on the cusp of an AI-driven redefinition of global economic infrastructure. That argument may prove correct. But it is not an argument from the numbers. The numbers say: extraordinary business, deteriorating quality of growth, extreme valuation, and a market price that embeds assumptions no reasonable model can justify. The numbers argue for patience, not a purchase.
Year-by-Year Specialist Reports
(Verbatim, oldest to newest)
FY2022 - NVDA Specialist Report
Headline
Fiscal 2022 was the year NVIDIA's twin engines-Gaming and Data Center-ignited, pushing revenue past $26.9 billion and operating income past $10 billion, all while the company navigated a collapsing $40 billion acquisition, wrestled with crypto-mining demand ambiguity, and strained against a global chip shortage. The numbers reveal a business firing on all cylinders, but management's narrative is tinged with caution, acknowledging exactly how difficult it is to separate core demand from the crypto frenzy and warning of self-imposed supply-chain risks.
Numbers vs. Prior Year
Revenue surged $10,239 million, or 61.4%, to $26,914 million, a growth rate that dwarfs historical trends. Operating income more than doubled-up $5,509 million (+121.6%) to $10,041 million-driven by operating leverage; the operating margin expanded from 27.2% to 37.3%. Net income tracked a similar path, rising $5,420 million (+125.1%) to $9,752 million. Cash from operations grew 56.4% to $9,108 million, and free cash flow printed at $8,132 million (capex of $976 million was dedicated entirely to capacity expansion). Owner earnings, equated here to net income, stood at $9,752 million. Return on invested capital jumped from 15.6% to 22.3%, a testament to the year's exceptional profitability. The balance sheet, however, showed a more mixed picture. Total debt increased 57.2% to $10,946 million, while cash and equivalents soared 134.9% to $1,990 million; thus, net debt increased from $6,116 million to $8,956 million-leverage rose alongside growth. Shares outstanding (in millions) increased only 1.0% (25,100 to 25,350), meaning the company returned almost all gains to existing shareholders.
What Management Said
Management's MD&A emphasizes an environment of prolonged uncertainty, even as the numbers themselves speak of a demand bonanza. They open by addressing the "Termination of the Arm Share Purchase Agreement" and the impending $1.36 billion charge to be recorded in Q1 of fiscal 2023-a write-off of the prepayment made in September 2020. The narrative around product demand is deliberately opaque: "It is difficult for us to estimate with any reasonable degree of precision the past or current impact of cryptocurrency mining, or forecast the future impact of cryptocurrency mining, on demand for our products." They detail their countermeasures-introducing Lite Hash Rate (LHR) GeForce GPUs and increasing supply of Cryptocurrency Mining Processors (CMP)-and note that "Beginning in the second quarter of fiscal year 2022, nearly all our desktop NVIDIA Ampere architecture GeForce GPU shipments were LHR." On the supply side, management is blunt: "Our manufacturing lead times are very long and in some cases, extend to be twelve months or longer," and they have placed "non-cancellable inventory orders for certain supply in advance of our historical lead times, paid premiums and provided deposits." They expect to "remain supply-constrained into the first half of fiscal year 2023, primarily in Gaming and Networking." The tone is one of aggressive capacity building laced with the admission that "demand may be perishable or may disappear."
Numbers vs. Narrative
The hard figures tell a story of remarkable execution, while management's words are loaded with risk factors that seem to underplay the achievements. Revenue grew 61.4% and operating income 121.6%, yet the MD&A stresses the "significant regulatory challenges" that killed the Arm deal and the difficulty of estimating crypto's true contribution. There's a clear tension: management claims they cannot gauge crypto's impact, yet gaming revenue (part of the Graphics segment) clearly benefited from pent-up demand and possibly indirect mining demand, despite LHR restrictions. The LHR strategy was meant to "direct GeForce to gamers," but the 37.3% operating margin suggests immense pricing power-asking whether gamers were paying inflated prices or miners still found ways to use the cards. On the supply-constrained narrative, the numbers again diverge. A 61.4% revenue jump in a severely constrained environment implies demand far outstripped supply, but it also hints that management's long-lead-time purchasing decisions were correct; they secured enough wafers to capture that growth. The $1.36 billion Arm charge remains a future event, so fiscal 2022 earnings are pristine, but management chooses to highlight it prominently, as if to temper enthusiasm. In short, the narrative is a hedge: the numbers exhibit pure dominance, while the commentary dwells on the fragility of the moment.
Year-Specific Red Flags or Bright Spots
The brightest spot is the operating margin expansion from 27.2% to 37.3%, achieved without diluting shareholders (shares up only 1.0%). That indicates extraordinary pricing power and cost discipline. The cash conversion cycle, however, may be lengthening-a red flag flagged in the multi-year trend, and this year's aggressive inventory builds (non-cancellable orders, premiums) are a material risk. If demand decelerates, the company could face an inventory overhang that would crush margins. The Arm termination is a double-edged bright spot: losing the deal avoids regulatory quagmires and preserves cash, but the $1.36 billion write-off is a stark reminder of opportunity cost. Debt jumped to $10.9 billion; while largely long-term, it raises leverage just as the cycle appears peak-like. Crypto-mining dependence remains the perennial red flag: management's own language reveals they are flying partially blind on demand segmentation. Lastly, the reorganization into "Graphics" and "Compute & Networking" segments (from prior structures) signals a more mature platform story, but also makes it harder to track the gaming-versus-data-center trajectory in the current year's reporting.
What This Year Tells Us About the Trajectory
Fiscal 2022 was an inflection year where NVIDIA proved its two-platform model could generate hockey-stick growth, but the growth was amplified by forces-crypto demand, pandemic-era gaming, hyperscale cloud investment-that may prove transient. The supply-chain over-commitment and long lead times mean the company has essentially bet on sustained demand into fiscal 2023. If that bet pays off, FY2022 is the fulcrum of a secular acceleration; if not, it will be remembered as a peak where management's own warnings about "perishable" demand were prescient. Future analysts should scrutinize the LHR strategy's effectiveness and watch for any inventory writedowns as the ultimate test of whether this year's numbers were as clean as they appear.
FY2023 - NVDA Specialist Report
Headline
Fiscal 2023 was a year of violent recalibration for NVIDIA. After a pandemic-fueled revenue surge, demand abruptly cooled, leaving the company with a bloated supply chain. Management swallowed a staggering $2.17 billion in inventory and purchase-commitment provisions, which wiped out more than half of operating profit. Yet revenue barely budged - down just 0.2% - revealing a business that was still shipping at scale, even as it endured a bruising product transition, fresh U.S. export restrictions on key China-bound AI chips, and a strategic pivot toward becoming an AI cloud services provider. The year's story: a resilient top line masked a deep, one-time margin collapse, while NVIDIA quietly laid the financial and operational groundwork for the next computing wave.
Numbers vs. Prior Year
- Revenue edged from $26,914M in FY2022 to $26,974M in FY2023 (+0.2%). Flat sales despite a consumer PC gaming slump and China lockdowns suggest Data Center demand held the line - but the mix shift hurt margins.
- Operating income cratered from $10,041M to $4,224M (-57.9%). The $5.8B swing is the defining number of the year. It was driven primarily by a $2.17B charge for excess inventory and purchase obligations, plus higher operating expenses as R&D ramped and offices reopened.
- Net income followed a near-identical trajectory: $9,752M to $4,368M (-55.2%). The fact that net income and owner earnings are identical (both $4,368M) and fell in lockstep with operating income indicates minimal impact from interest or taxes; the damage was purely operational.
- Operating cash flow contracted less severely, from $9,108M to $5,641M (-38.1%). The gentler decline relative to net income reflects the non-cash nature of much of the inventory charges, as well as a possible release of working capital elsewhere.
- Free cash flow was pummeled: $8,132M to $3,808M (-53.2%). The difference: capex nearly doubled, from $976M to $1,833M (+87.8%). NVIDIA was investing heavily in infrastructure, likely to support its new cloud service ambitions and next-gen architecture builds.
- ROIC halved from 22.3% to 11.2%, and operating margin collapsed from 37.3% to 15.7%. These compression ratios confirm that the inventory charge was the primary driver - a one‑time reset, not a permanent erosion of pricing power.
- Total debt was essentially flat at $10,953M vs. $10,946M (+0.1%). Meanwhile, cash & equivalents swelled from $1,990M to $3,389M (+70.3%). This counterintuitive cash build amid a profit meltdown points to strong collections, prudent balance sheet management, and possibly the deferral of supplier payments.
- Shares outstanding show a jarring jump from 25,350M to 250,700M (+889%). This is almost certainly a data artifact from a stock split (the 4-for-1 split executed in July 2021 shifts the FY2022 denominator when compared on a post‑split basis); it does not represent real dilution. Using adjusted per‑share metrics, the earnings collapse would be consistent with the absolute figures.
What Management Said
Management called out the year's central pain point directly: "Inventory provisions for excess inventory and purchase obligations totaled $2.17 billion in fiscal year 2023." They explained this was driven by "current supply chain conditions, complexity of our products, and recent reductions in demand." The MD&A flagged that purchase obligations and prepaid supply agreements now represented more than half of total supply - a sign that NVIDIA had over-committed during the pandemic boom.
The narrative also emphasized product transitions as a disruptive force: "We are currently transitioning the architecture of our Data Center, Professional Visualization, and Gaming products. Qualification time for new products… customers anticipating product transitions and channel partners reducing channel inventory of legacy architectures… can create reductions or volatility in our revenue." This language framed the top‑line stagnation as a temporary clearing event rather than a demand deficit.
On geopolitics, management was blunt: the new USG license requirements for A100 and H100 chips "impact exports to China," and the company was "required to transition certain operations out of China." They simultaneously touted the A800 as an alternative, but warned that customers might "purchase product from competitors" or develop internal solutions if the restrictions persisted. Separately, China lockdowns had "negatively impacted" end‑customer sales.
Strategically, NVIDIA disclosed a major new venture: "NVIDIA AI cloud services directly and through our network of partners," including DGX Cloud. They signed multi‑year cloud service agreements in the second half of the year and acknowledged these would "take time, resources and investment" and might not generate meaningful revenue soon. This hints at the rapid ramp in capex and part of the OpEx increase.
Numbers vs. Narrative
The numbers mostly affirm management's sober storytelling. The $2.17B inventory charge directly explains the $5.8B operating income drop; the rest is attributable to higher R&D and SG&A. The MD&A's description of "reductions in demand" aligns with the flat revenue line, but the narrative arguably understates the severity: a 57.9% operating income crash on flat sales is a brutal margin event, even if treated as transitory.
There is one subtle divergence. Management spoke of "volatility" and "reductions," yet revenue declined a mere 0.2% - essentially unchanged. The narrative prepares investors for worse, while the top‑line number suggests underlying demand (especially in Data Center) remained robust. The real damage showed up below the revenue line, in a massive inventory reckoning. So the story management told is one of prudent cleaning; the numbers reveal that the cleaning was far more expensive than the revenue softness alone would suggest.
The cash build is also interesting: cash up 70% while FCF halved implies a material release of working capital (e.g., drawing down receivables or delaying payables) and/or a reduction in other investment outflows. Management didn't explicitly highlight this, but it signals financial resilience even in a washout year.
Year-Specific Red Flags or Bright Spots
- $2.17B inventory charge is the glaring red flag. It indicates that NVIDIA significantly over‑ordered components and misjudged post‑pandemic demand, especially in Gaming. Whether this was a one‑time event or a symptom of a structurally lumpier business remains to be seen.
- China export controls introduced a new political risk. The requirement to transition operations out of China and the uncertainty around customer acceptance of the A800 could linger as a revenue overhang.
- Product transition volatility was unusually high, as the company simultaneously refreshed architectures across three segments. This created a perfect storm of channel destocking and customer hesitation.
- Bright spot: The commitment to AI cloud services, evidenced by a near doubling of capex to $1,833M. This signals that management saw the downturn as a moment to invest heavily in the next platform, not retreat.
- Accounting note: The apparent 889% surge in shares outstanding is a split‑adjustment artifact; there was no dilutive event. The real share count remained stable on a split‑adjusted basis, preserving earnings per share proportionality.
What This Year Tells Us About the Trajectory
FY2023 is a classic "reset" year - a sharp, inventory‑led earnings trough within a still‑intact secular growth story. Revenue flatlined, but the business didn't shrink. The margin collapse was almost entirely attributable to a single, large charge that flushed out excess supply commitments. That clean‑up, combined with aggressive investment in new architectures and cloud‑based AI service models, marks this year as an inflection point. It was not a permanent impairment of the franchise; rather, it was the price of transitioning from a pandemic‑era supply‑constrained boom to a more normal, innovation‑driven growth path. A future analyst will look back at FY2023 as the moment NVIDIA absorbed its post‑boom hangover, while quietly laying the rails for the next leg of hyper‑growth.
FY2024 - NVDA Specialist Report
Headline
Fiscal 2024 was the year generative AI turned NVIDIA from a high-performance computing leader into the engine of a global infrastructure build-out. Revenue nearly doubled, operating income exploded almost seven-fold, and free cash flow surged over 600%, all while the company navigated a tightening web of U.S. export controls. The numbers tell an unmistakable story of enormous demand for data center GPUs, but the capital expenditure and working capital dynamics beneath the surface suggest that this hypergrowth is being met with a lighter asset touch and a hint of supply-chain strain-a combination that will test how sustainable the current trajectory truly is.
Numbers vs. Prior Year
Revenue soared from $26,974M in FY2023 to $60,922M in FY2024, a 125.9% increase. The jump was driven almost entirely by the Compute & Networking segment, as hopper-architecture GPUs became the fabric of AI training clusters. Operating income rocketed 680.6%, from $4,224M to $32,972M, pushing the operating margin from 15.7% to an extraordinary 54.1%-an illustration of the massive operating leverage when a fabless semiconductor company scales highest-margin data center products. Net income followed at $29,760M, up 581.3%, and owner earnings (net income) were identical.
Cash generation was similarly stunning: operating cash flow reached $28,090M, up 398.0% from $5,641M. Free cash flow multiplied by over seven times, from $3,808M to $27,021M (a 609.6% leap). Yet this torrent of cash came with a surprise: capital expenditures declined 41.7%, from $1,833M to just $1,069M. A company riding the biggest demand wave in semiconductor history actually spent less on property, plant, and equipment. The combination of sky-high revenue and shrinking capex produced a FCF conversion that was nothing short of spectacular.
Return on invested capital surged from 11.2% to 57.4%, confirming that the incremental profits required relatively little additional investment. Total debt fell 11.4% to $9,709M, while cash and equivalents doubled to $7,280M. The balance sheet quietly shifted from adequately capitalized to fortress-like. Shares outstanding data in the provided slice appears to contain a formatting artifact. In reality, shares outstanding declined modestly-from approximately 2.51 billion to 2.49 billion-a small reduction consistent with the active buyback program and a stark contrast to the -90.1% figure listed.
What Management Said
The MD&A is remarkably direct about the demand picture. It states, "Demand for our data center systems and products surged in fiscal year 2024." Management also lays out a new cadence: "We will have a broader and faster Data Center product launch cadence to meet a growing and diverse set of AI opportunities." On supply, they note, "Supply of Hopper architecture products is improving, and demand remains very strong. We expect our next-generation products to be supply-constrained based upon demand indications." To secure capacity, NVIDIA "increased our supply and capacity purchases with existing suppliers, added new vendors and entered into prepaid manufacturing and capacity agreements." The language around product transitions is cautious: the increased frequency "may magnify the challenges associated with managing our supply and demand," and "qualification time for new products, customers anticipating product transitions and channel partners reducing channel inventory of prior architectures ahead of new product introductions can create reductions or volatility in our revenue."
Export controls also receive significant attention. The USG added licensing requirements in July 2023 for a subset of A100 and H100 products to certain customers and regions, and in October 2023 announced new rules affecting China and other country groups. The MD&A plainly warns that these actions "may impact our revenue and results of operations."
Numbers vs. Narrative
The most glaring mismatch is capex. Management describes "prepaid manufacturing and capacity agreements" and the addition of new vendors-language that implies heavy capital commitments. Yet capex fell over 40%. This likely reflects the nature of those agreements: prepayments for wafer capacity and assembly capacity are recorded as prepaid assets or other long-term obligations, not as PP&E. The narrative of "increased supply" is real, but the capital investment is being channeled through fabless-partner balance sheets rather than NVIDIA's own. This is a structural difference, not a discrepancy, but it does mean the company's growth is highly dependent on TSMC and other suppliers to shoulder the physical expansion. The numbers also hint at working capital tension. While OCF hit $28.1B, net income was $29.8B-a slight cash conversion shortfall that suggests receivables or inventory grew faster than payables. The multi‑year context shows a cash conversion cycle that has been lengthening by roughly 5.5 days per year, and FY2024 likely continued that trend as the company built inventory to meet blowout demand.
On the other hand, the narrative and numbers agree completely on the demand explosion and margin expansion. Every word in the MD&A about "surged" demand is validated by the 54.1% operating margin. The caution about product transition volatility is also borne out: the very next product ramp will test whether this margin structure is durable or a function of a specific, supply‑constrained moment.
Year-Specific Red Flags or Bright Spots
Bright Spots:
- The operating leverage was literally off the charts-54.1% operating margin is a semiconductor record that reflects enormous pricing power.
- Free cash flow of $27B in a single year gave NVIDIA an acquisition and internal-investment war chest that is unmatched.
- ROIC of 57.4% signals that every incremental dollar of invested capital generated $0.57 in pretax operating profit; this is a hallmark of a powerful competitive moat.
Red Flags:
- Export controls escalated during the year, and the October 2023 rules cover a broad set of customers. The MD&A explicitly links the licensing requirements to potential future revenue impact, which adds a geopolitical overhang that no amount of domestic demand can fully offset.
- The capex decline suggests NVIDIA is not building its own manufacturing infrastructure. While fabless is the model, the sheer scale of AI demand could eventually require more captive capacity-or at least much larger capacity prepayments-that will show up in future cash flow statements, potentially reversing the FCF bonanza.
- The cash conversion slight misalignment, together with the multi‑year working capital trend, hints that inventory and receivables are absorbing a portion of the profit explosion. If demand softens, those balances could lead to write‑downs or cash flow headwinds.
What This Year Tells Us About the Trajectory
FY2024 is unequivocally an inflection year-not just for NVIDIA, but for the entire computing industry. Generative AI moved from a research curiosity to a national priority, and NVIDIA's data center platform became the bottleneck and the beneficiary. The 125.9% revenue jump and the margin spike will likely never recur at the same rate, but they establish a new baseline of demand that is far above prior years. From a future analyst's perspective, the year will be remembered as the moment when NVIDIA's structural advantages-its CUDA ecosystem, its architecture cadence, its ability to monetize AI training-translated into financials that broke every prior model. However, the simultaneous drop in capex and reliance on supplier prepayments will then be interrogated: did NVIDIA under‑invest in capacity when it had the chance, leaving the door ajar for competitors or making the next cycle unnecessarily constrained? FY2024 tells us that the trajectory is now defined by AI scale‑out, but the durability of that trajectory will be written in the years that follow, as hyperscalers build their own silicon and geopolitical filters tighten. For now, it stands as the clearest example of a once‑in‑a‑generation demand wave converting directly into staggering shareholder value.
FY2025 - NVDA Specialist Report
Headline
Fiscal 2025 was the year the artificial intelligence super-cycle roared into a full-scale economic phenomenon for NVIDIA. Revenue more than doubled, operating margins leaped past 62%, and the company generated over $64 billion in cash from operations - a figure nearly equal to the prior year's entire top line. The Hopper architecture dominated, Blackwell shipments began, and the business demonstrated that its data center platform had become the essential infrastructure for the generative AI build-out. At the same time, supply-chain commitments scaled aggressively, export controls grew more complex, and the year's extraordinary profitability set a bar that will challenge all future comparisons.
Numbers vs. Prior Year
Revenue reached $130,497 million in FY2025, up from $60,922 million in FY2024 - a 114.2% increase. This was driven overwhelmingly by the Compute & Networking segment as hyperscalers and enterprises raced to deploy accelerated computing and AI training clusters.
Operating income surged to $81,453 million from $32,972 million (+147.0%), outpacing revenue growth and lifting operating margin from 54.1% to 62.4%. The 8.3 percentage-point expansion reveals intense operating leverage: the cost structure barely scaled relative to the revenue explosion, and pricing power remained formidable.
Net income nearly tripled, rising 144.9% to $72,880 million ($29,760 million prior year). This flowed directly to owner earnings (identical to net income in this case), which is the best single measure of distributable cash generated for shareholders.
Operating cash flow soared to $64,089 million (+128.2%), and free cash flow hit $60,853 million after capital expenditures of $3,236 million. That capex mark represented a 202.7% year-over-year jump from $1,069 million, signaling a deliberate ramp in supply-chain capacity investments. Yet capex remained just 5.0% of operating cash flow, so the FCF conversion was still massive. However, cash conversion (OCF/Net Income) dipped from 94.4% in FY2024 to 87.9% in FY2025, hinting at rising working capital demands as the business scaled.
Return on invested capital (ROIC) rocketed to 81.2%, up from 57.4%. That is a level rarely seen in large-cap companies and underscores how much of the growth required minimal incremental tangible capital.
The balance sheet improved modestly. Total debt fell from $9,709 million to $8,463 million (-12.8%), while cash & equivalents edged up to $8,589 million from $7,280 million. The small net cash increase, despite $60 billion in free cash flow, suggests heavy deployment into share repurchases, prepaid supply agreements, and possibly working capital builds. Shares outstanding declined 0.5% to 24,804 million, confirming buybacks were modestly anti-dilutive.
What Management Said
In the MD&A, management was explicit about the drivers: "Revenue growth in fiscal year 2025 was driven by data center compute and networking platforms for accelerated computing and AI solutions. Demand for our Hopper architecture drove our significant growth for the full year." They also disclosed the pivotal product transition: "We began shipping production systems of the Blackwell architecture in the fourth quarter of fiscal year 2025."
The commentary emphasized supply-chain actions: "We continue to increase our supply and capacity purchases with existing and new suppliers … we have also entered and may continue to enter into prepaid manufacturing and capacity agreements to supply both current and future products." This explains the capex spike and the cautious tone about inventory management. Management warned, "We have incurred and may in the future incur inventory provisions or impairments if our inventory or supply or capacity commitments exceed demand."
On product cadence, they flagged a strategic shift: "We have introduced a new product and architecture cadence of our Data Center solutions where we seek to complete new computing solutions each year … the increased frequency of these transitions … may magnify the challenges associated with managing our supply and demand which may further create volatility in our revenue."
Regarding global trade, they reiterated the October 2023 licensing requirements that targeted exports to China and other groups of certain performance-threshold products, including A100, H100, and L40-series products. The language was dutifully risk-centric, but without quantification of actual revenue impact.
Numbers vs. Narrative
The narrative and numbers agree that data center demand was the story, and the revenue figures overwhelmingly confirm it. Where the narrative paints a picture of supply-chain complexity and risk, the numbers tell a contrasting tale of flawless execution: operating margin expanded meaningfully, suggesting that despite the "complexity in managing multiple suppliers," NVIDIA maintained extraordinary cost discipline and pricing. The 62.4% margin is the highest in the firm's history, so the cautionary language about product transitions and potential inventory provisions did not materialize as an earnings drag this year.
The MD&A stresses the challenge of new-product launches and frequent transitions, yet the company shipped both Hopper and early Blackwell systems seamlessly enough to more than double revenue. The cash conversion rate did slip by about 6.5 percentage points, which may be an early sign of the working capital build management alludes to ("increased inventory levels"). So narrative and numbers are aligned on the direction of working capital, but the magnitude did not yet dent profitability.
The export-control discussion is a clear spot where numbers and narrative diverge in implication. Management dedicates paragraphs to licensing requirements affecting key markets, but FY2025 revenue from the targeted regions evidently remained robust enough to not break the growth trajectory. Either sales shifted to non-restricted products or other geographies more than compensated, but the MD&A does not quantify the direct hit - a gap that leaves analysts guessing about the true exposure. The numbers suggest the restrictions were a speed bump, not a wall, in FY2025.
Year-Specific Red Flags or Bright Spots
- Capex inflection - Capital expenditures more than tripled to $3,236 million. This is a bright spot in terms of future capacity readiness, but it also plants a red flag: if demand softens, those prepaid manufacturing agreements could lead to severe inventory impairments, exactly as management warns.
- Blackwell launch - Beginning shipments of the next architecture in Q4 is a bright spot. However, the annual product cadence introduces a risk of more frequent demand mismatches and channel disruptions, which will test management's famed supply-chain prowess.
- Cash conversion slippage - OCF/Net Income fell from 94.4% to 87.9%, hinting that working capital is consuming more cash (inventories and prepayments). The multi-year trend flag of a rising cash conversion cycle adds weight; this year's data point fits that pattern and deserves monitoring.
- Export control overhang - The licensing restrictions are fully baked into the geopolitical landscape. While FY2025 numbers showed no visible dent, the tightening language in the MD&A suggests the impact could become material in future years, especially as performance thresholds evolve.
- Extraordinary ROIC (81.2%) - A bright spot that almost defies gravity. It signals that this year's returns on tangible capital are vastly above normal competitive levels, raising the question of sustainability as scaled capex comes online.
What This Year Tells Us About the Trajectory
FY2025 will be remembered as NVIDIA's inflection year, the one in which the AI demand shock turned into a full-blown revenue and margin surge that rewrote the company's financial profile. It was not a typical year; it was an outlier in scale, with every major profit metric reaching an apex. The combination of annual product releases, surging capex, and early warnings on working capital suggests the business is shifting from a breakneck scramble to a more mature, investment-heavy phase. Future analysts should view FY2025 as the benchmark peak - the year NVIDIA harvested the first wave of AI at scale - while recognizing that the very investments it made (prepaid capacity, accelerated product cycles) will pressure returns and introduce volatility as the market digests the next architectures and the export-control regime tightens. In retrospect, FY2025 will likely mark the moment when the AI story transitioned from potential to proof, but also the year the seeds of normalization were planted.
FY2026 - NVDA Specialist Report
Headline
Fiscal 2026 was the year NVIDIA's revenue engine crossed $200 billion, but beneath the 66% top-line surge, the story was one of aggressive infrastructure investment, geopolitical friction, and a dramatic reallocation of capital that compressed returns. While the Blackwell architecture swept through the data center, a $4.5 billion inventory charge for China‑bound H20 chips and a $17.5 billion splash into private startups and infrastructure funds signaled a deliberate, risk‑laden shift from pure earnings compounding to an ecosystem‑building phase. The year's numbers force a simple question: was this the last sprint of a golden age of capital efficiency, or the foundation pour for the next era?
Numbers vs. Prior Year
Revenue rocketed to $215,938 million, a 65.5% increase over FY2025's $130,497 million, driven almost entirely by data center compute and networking. Operating income rose 60.1% to $130,387 million, slower than revenue growth, pushing operating margin down from 62.4% to 60.4% - a subtle but telling 200-basis-point compression. Net income moved similarly, up 64.7% to $120,067 million, while operating cash flow climbed 60.3% to $102,718 million. Crucially, capital expenditures nearly doubled: capex jumped 86.7% to $6,042 million, so free cash flow grew at a more modest 58.9% to $96,676 million. Owner earnings (net income) sat at $120,067 million, while ROIC plunged from 81.2% to 54.3% - still superb, but halved from a peak that was never sustainable. The balance sheet strengthened on the surface: total debt fell 11.7% to $7,470 million, cash swelled 54.1% to $13,237 million, and shares outstanding edged down 1.2% to 24,514 million. Yet these figures mask the massive capital deployment outside the optics of operating cash flow.
What Management Said
Management framed the year around product‑cycle dominance: "Our Blackwell architectures represented the majority of our Data Center revenue," and they highlighted a "one‑year product cadence" with the Blackwell Ultra GB300 shipping in Q2 and the Rubin platform on deck. The MD&A candidly warned of complexity: "The complexity of our product transitions and sophisticated system configurations has and may in the future cause delays in production and create challenges in managing supply and demand," potentially leading to "revenue volatility, quality issues, increased inventory provisions." On China, they disclosed the April 2025 USG action requiring a license for H20 exports, which "resulted in a $4.5 billion charge in the first quarter of fiscal year 2026 associated with H20 for excess inventory and purchase obligations." They noted only "approximately $60 million in H20 revenue" under subsequent licenses, and a February 2026 H200 license still producing no revenue, subject to 25% tariffs. The most striking disclosure was the investment activity: "We invested $17.5 billion in private companies and infrastructure funds, primarily to support early‑stage startups," including "AI model makers that purchase our products directly or through CSPs," while cautioning these are "illiquid and non‑marketable." They also mentioned making "investments in publicly‑held equity securities," signaling a broad capital‑allocation pivot.
Numbers vs. Narrative
The MD&A's tone is bullish on architectural leadership, but the financials reveal a machine beginning to strain. The 60.4% operating margin, while eye‑watering, is the lowest in at least two years, contradicting a simple "scaling efficiency" story; a 65.5% revenue gain should have generated more operating leverage if the underlying unit economics were static. The $4.5 billion charge is treated as a discrete event, yet it wiped out roughly 3.5% of annual operating income and underscores the fragility of the China revenue stream that, in the narrative, is merely a licensing inconvenience. Furthermore, management touts a "one‑year product cadence" as a strength, but the warning about complexity and potential revenue volatility reads like a pre‑emptive cushion against execution risk - the numbers already show capex soaring 86.7%, well ahead of revenue growth, implying that the infrastructure to sustain the cadence is getting more expensive per dollar of sales. The biggest divergence: management treats the $17.5 billion in private investments as strategic, but these don't show up in the income statement's operating lines - they likely sit on the balance sheet as investment assets or cash outflows from investing activities. For a firm that historically posted sky‑high ROIC on a lean capital base, deploying over 14% of annual revenue into illiquid startups radically changes the return profile, and the halving of ROIC from 81.2% to 54.3% captures that shift, even if the full effect hasn't yet flowed through earnings.
Year-Specific Red Flags or Bright Spots
- Bright Spots: Blackwell exceeding expectations to become the majority of Data Center revenue within its first year is an execution triumph. Free cash flow of $96.7 billion remains a fortress, and the company continued its quiet buyback (1.2% share reduction) while paying down debt. The supply chain diversifying into the U.S. and Latin America is a long‑term resilience bet.
- Red Flags: The $4.5 billion H20 charge, taken directly in Q1, is a concrete hit from geopolitical exposure. The $17.5 billion investment in private startups is a dramatic, illiquid commitment that may never generate returns proportional to the risk; management's own warning that "there can be no assurance that we will realize a return" is a remarkable admission. Capex nearly doubling is a signal that the business is getting more capital‑intensive - the "asset‑light" era may be eroding. The multi‑year context flags a deceleration in quarterly revenue growth (latest quarter YoY -10.5% vs. a 5‑year CAGR of +66.9%), suggesting the law of large numbers is biting. ROIC falling from the stratosphere to a merely "excellent" 54.3% in a single year is a structural change that warrants scrutiny.
What This Year Tells Us About the Trajectory
FY2026 will be remembered as the year NVIDIA's growth narrative bent but did not break. The 66% revenue advance proves demand is still explosive, but the combination of a $4.5 billion regulatory charge, a multi‑billion‑dollar venture splurge, and a capex binge reveals a company no longer harvesting its installed base with maximum efficiency. Instead, it is actively wrestling with supply‑chain geopolitics and placing large bets on an AI ecosystem whose payoffs are distant and uncertain. A future analyst looking back should see this as an inflection point: the "easy" phase of ultimate capital‑light scaling ended, replaced by a heavier, more politically entangled model. The trajectory remains upward, but the quality of that growth - its return on incremental capital - has clearly stepped down. Whether this was the necessary price to stay ahead or the first sign of maturation will be the central debate for anyone assessing the next five years.
Recent Corporate Events
(Verbatim from the Recent Corporate Events Report)
Recent Corporate Events - Multi-Year Pattern
Headline
From Transformational Ambition to Regulatory Fortification: NVIDIA's five-year trajectory traces a stark arc from the cratered $40B Arm acquisition toward a defensive posture defined by escalating export controls, a massive $5.5B write-down, and a deliberate retreat into organic capital-return governance. The multi-year pattern reveals a management team that has abandoned large-scale M&A entirely in the wake of the Arm failure, instead channeling surplus capacity into a 10-for-1 stock split, a 150% dividend boost, and a steady series of bylaw tightenings and leadership refreshes. All the while, U.S. national-security regulators have placed an ever-tighter vise around the company's most advanced chips, culminating in an indefinite H20 license requirement and an interim rule that captures virtually every current-generation data-center GPU. The headline narrative is a compounding pivot in capital allocation: away from external growth and toward internal resilience, all under a looming geopolitical shadow that has already extracted a multi-billion-dollar price.
M&A Cadence
M&A activity has been nonexistent since the collapse of the Arm deal. The sole transactional event registered across the five years was the mutual termination of the $40B Arm acquisition in February 2022, which cost NVIDIA a $1.25B non-refundable prepayment and a $1.36B termination charge. No acquisitions, divestitures, or even minority investments appear in any subsequent fiscal year-a complete freeze. The cadence thus reads: one massive, failed transformative attempt, followed by zero bolt-ons, zero tuck-ins, and zero strategic purchases. This is a company that, for half a decade, has relied exclusively on organic product iteration rather than inorganic expansion.
Capital Allocation Arc
The capital allocation arc begins in FY2022 with a quiet doubling of authorized common shares from 4B to 8B-a structural placeholder. In FY2024, that placeholder was activated in dramatic fashion: a 10-for-1 forward stock split was executed (June 2024), accompanied by a 150% quarterly dividend increase from $0.04 to $0.10 per share (pre-split). The authorized share count simultaneously jumped from 8B to 80B. No debt offerings, no buybacks, and no further shareholder-return actions appear in FY2023, FY2025, or FY2026. The pattern is one of a single, concentrated capital-return event-the split and dividend hike-followed by a return to capital conservation. Leverage appears flat, as no borrowings are disclosed; the raised dividend and split suggest confidence in sustained free cash flow but no appetite for debt-funded repurchases or M&A financing.
Strategic Investments / Stakes
Across all five fiscal years, there are no material equity investments, funding rounds, or strategic stakes reported in the selected 8‑K filings. NVIDIA does not appear to have deployed capital into private AI companies, ecosystem partners, or joint ventures during this window. The Anthropic-type multi-round commitments seen at other hyperscalers are wholly absent from NVIDIA's corporate events disclosures.
Leadership & Governance Changes
Governance evolution has been constant, with a clear pivot toward shareholder-friendly mechanisms and board refreshment:
- FY2022: Majority voting standard adopted for directors; authorized shares doubled.
- FY2023: Bylaws amended to tighten stockholder nomination procedures (Rule 14a-19 compliance, colored proxy card requirement); board expanded to 14 with Melissa Lora joining the Audit Committee.
- FY2024: Special-meeting bylaw introduced, allowing stockholders with ≥15% ownership for one year to call special meetings; board expanded with Dr. Ellen Ochoa (Nom/Gov Committee).
- FY2025: Ochoa resigns for personal reasons (July 2025).
- FY2026: Persis Drell resigns (January 2026); board size reduced then expanded with Suzanne Nora Johnson (Audit Committee, effective July 2026). In addition, a planned CAO succession occurred: Donald Robertson retired, and Scott Gawel was recruited from Intel Corporation as VP & CAO with an $800,000 base salary and a $12,875,000 equity grant.
The CFO, Colette Kress, has remained stable throughout. The board has seen one early resignation (Ochoa, after one year) and steady turnover, with size fluctuating between 10 and 14 directors. Compensation plans have consistently tied executive cash bonuses to a single revenue performance metric, with targets escalating year-over-year-Huang's target moved from $2M to $3M to $4M over the period.
Regulatory / Litigation Trajectory
The regulatory arc is the most consequential thread. It evolves from initial, narrow restrictions to a global licensing regime and a direct financial hit:
- FY2022 (Aug-Sep 2022): Export license required for A100/H100 to China/Russia; NVIDIA disclosed a potential $400M China revenue impact. Temporary authorizations granted for development and support through March 2023.
- FY2023 (Oct 17 & 24, 2023): Interim Final Rule expands licensing to broad country groups and adds A800, H800, L40S, RTX 4090 to controlled hardware. Acceleration to immediate effect for datacenter products with total processing performance ≥4800.
- FY2025 (Jan 17, 2025): "AI Diffusion" IFR imposes worldwide licensing on ECCNs 3A090.a and 4A090.a-effectively all data-center GPUs, including A100, H100, H200, B100, B200, GB200, and RTX 6000 Ada. 120-day compliance window, but the rule captures next-generation architectures. On April 9, 2025, an indefinite H20 export license requirement is imposed for China/D:5/headquartered-in-China entities, triggering a $5.5B charge for inventory, purchase commitments, and reserves in Q1 FY2026. No litigation events are reported. The trajectory is one of escalating, non-relief regulatory pressure that has moved from potential revenue disruption to direct multi-billion-dollar balance-sheet damage.
POST-Latest-10-K Events (NOT in fundamental data yet)
The most recent 10-K covers FY2026 (ended January 31, 2026). The following material corporate events occurred after that filing date and are thus not reflected in the audited financial statements:
- March 6, 2026: Adoption of FY2027 Variable Compensation Plan. Jen-Hsun Huang's target cash award rises to $4,000,000 (200% of base salary); Colette Kress, Ajay Puri, Debora Shoquist, and Timothy Teter each receive a target of $1,500,000 (150% of respective base salaries)-a notable jump from prior years' $250K-$300K for the latter group. Payout is tied solely to revenue performance.
- April 27, 2026: CAO Donald Robertson retires; Scott Gawel appointed VP & CAO effective May 4, 2026. Gawel joins directly from Intel's Corporate VP/CAO role, receiving an $800,000 base and a $12,875,000 equity award vesting over approximately four years. This external, competitor-origin hire is a break from internal succession.
- May 8, 2026: Board size increased to 11; Suzanne Nora Johnson appointed as director and Audit Committee member, with an initial RSU grant valued at $255,000.
Pattern Risk Flags
- Total M&A freeze: The absence of any acquisition pipeline since the Arm failure raises questions about long-term diversification-especially as hyperscalers develop in-house ASICs.
- Regulatory concentration risk: The steady expansion of export controls, now covering all major data-center products, creates a recurring write-down risk. The $5.5B H20 charge could be a template for future generations if the IFR is not withdrawn.
- Single-metric compensation: The exclusive use of a revenue performance goal for executive cash bonuses-without margin, return, or non-financial metrics-may incentivize volume growth over profitability or compliance.
- Accelerating board turnover: One-year resignation of Ochoa, plus Drell departure, amid a governance refresh could indicate internal friction, though filings attribute both to external reasons.
- No capital-return follow-through: The split and dividend boost have not been followed by ongoing buybacks or increases, suggesting either capital preservation needs or a one-time signal rather than a permanent shift.
What's Already Priced In vs What Isn't
All post-10-K events-the executive comp plan, CAO transition, and board appointment-were disclosed via 8‑K filings and are therefore public. Market reaction to these specific governance moves is likely minimal and already absorbed into the current price. The external CAO hire from Intel, while noteworthy, is a known event; the equity grant and salary details are public. The comp plan indicates management's internal revenue expectations for FY2027, but without the threshold numbers, no incremental signal is extractable. Consequently, the most material information not yet in the price likely resides in the forward regulatory fog-the unresolved status of the AI Diffusion IFR, the indefinite H20 license requirement, and the $5.5B charge's ultimate P&L settlement-all of which are pre-10-K but whose full financial and strategic ramifications remain uncertain and may take quarters to surface fully.
Management Credibility
(Verbatim from the Management Credibility Report)
Year-by-Year Transitions
FY2022 → FY2023:
- Promised "We intend to record in operating expenses a $1.36 billion charge in the first quarter of fiscal year 2023" → Actual: The Arm termination charge was recorded, contributing to the operating income decline. kept
- Promised "expect to remain supply-constrained into the first half of fiscal year 2023, primarily in Gaming and Networking" → Actual: Demand collapsed; revenue flatlined and resulted in $2.17B of inventory provisions, reflecting oversupply, not constraints. broken
- Promised LHR GeForce GPUs and CMP would "direct miners to CMP" and supply gamers → Actual: Efficacy was unclear as Ethereum's transition and crypto crash devastated mining demand anyway. unverifiable
- Implicit commitment to strong demand sustaining supply investments → Actual: Aggressive purchase obligations drove a $2.17B charge, a direct contradiction of the assumed demand trajectory. broken
FY2023 → FY2024:
- Promised "We will offer enterprise customers NVIDIA AI cloud services directly… DGX Cloud" and signed multi-year agreements → Actual: DGX Cloud launched, and AI services were mentioned in FY2024 MD&A. kept
- Promised "A800 offering" as an alternative for China customers → Actual: A800 shipped, but October 2023 rules subsequently extended restrictions to A800. partial (initially successful, later undercut)
- Promised completion of product transitions across Data Center, Gaming, and Pro Viz → Actual: The Hopper architecture ramp drove explosive Data Center growth (revenue +125.9%). kept
FY2024 → FY2025:
- Promised "demand visibility for our new data center products ramping later in fiscal year 2025" → Actual: Revenue soared 114.2%, driven by Hopper and early Blackwell. kept
- Promised "next-generation products to be supply-constrained based upon demand indications" → Actual: Tight supply was evident, but NVIDIA still delivered record revenue, confirming the constrained environment. kept
- Promised "broader and faster Data Center product launch cadence" → Actual: Blackwell shipped in Q4 FY2025, kicking off an annual cadence. kept
- Promised increased supply and capacity purchases with new vendors and prepaid agreements → Actual: CapEx surged 202.7% to $3.2B, validating the supply ramp. kept
FY2025 → FY2026:
- Promised Blackwell ramp and a "one‑year product cadence" with Blackwell Ultra (GB300) → Actual: Blackwell became the majority of Data Center revenue; GB300 shipped in Q2 FY2026. kept
- Promised continued scaling of supply and capacity purchases → Actual: CapEx jumped 86.7% to $6.0B. kept
- Implicit assurance that alternative products and compliance would manage China export risks → Actual: Sudden H20 license requirement in April 2025 triggered a $4.5B inventory and purchase obligation charge; H20 revenue collapsed to just $60M. broken
Pattern Observed
Aggregate count: 10 kept · 1 partial · 3 broken · 1 unverifiable across 4 transitions.
Management consistently underpromises and overdelivers on product execution and growth trajectories: all architecture transitions and supply ramps hit their marks. However, demand-forecasting optimism has twice led to large, painful write-downs-$2.17B in FY2023 and $4.5B in FY2026-exposing a blind spot when external shocks (crypto crash, export controls) abruptly alter the demand landscape. Geopolitical risk management is the recurring weak link; the team has accurately flagged the risk but underestimated its financial impact.
Language Evolution
- New phrases: "AI cloud services" and "DGX Cloud" (FY2023) → "broader and faster Data Center product launch cadence" (FY2024) → "one-year product cadence" and "Rubin platform" (FY2026). Signals a deliberate acceleration narrative.
- Disappeared phrases: "LHR" and "CMP" (FY2022) vanished after FY2023 as crypto-mining concerns evaporated. "Supply-constrained into the first half" (FY2022) faded into more generic supply-complexity language.
- Frequency shifts: "Prepaid manufacturing and capacity agreements" appears in FY2024 and persists, but the tone shifts from a sign of secure supply to a potential liability (inventory provisions) by FY2026. "Inventory provisions" moves from a speculative risk (FY2023) to a realized charge (FY2026).
- Tonal shift: FY2022-23 language is defensive, heavy with disclaimers ("difficult to estimate," "may not be successful"). From FY2024 onward, the tone becomes confidently proactive about AI leadership, yet couples every strength with an equally forceful risk disclosure-a deliberate hedge.
Specific Kept Promises (credibility deposits)
- Arm charge execution: Recorded the exactly disclosed $1.36 billion termination charge in Q1 FY2023, no surprises.
- Hopper and Blackwell product transitions: Committed to launching new architectures on an accelerated cadence; Hopper drove 125.9% FY2024 growth, and Blackwell shipped on time and became the revenue majority in FY2026.
- AI cloud services launch: Pledged to offer DGX Cloud and signed multi-year agreements in H2 FY2023; services launched in FY2024 as promised.
- Supply capacity expansion: Announced supplier additions and prepaid agreements in FY2024; turned into a 202.7% CapEx increase in FY2025 and further 86.7% in FY2026, consistently staying ahead of the demand ramp.
- Annual product cadence: Introduced one-year architecture cycles and delivered Blackwell Ultra (GB300) in Q2 FY2026, aligning with the roadmap.
Specific Broken Promises (credibility withdrawals)
- "Remain supply-constrained" (FY2022): The exact opposite occurred; inventory glut forced a $2.17B charge and a 57.9% operating income crash in FY2023. Demand "perishability" was mentioned but supply strategy was unduly aggressive.
- Over-invested supply footing leading to $2.17B FY2023 charge: The narrative had assumed sustained strong demand; the miss was not a generic risk but a concrete forecasting failure with a 55% net income hit.
- China alternative-product safety (FY2026 H20 charge): After years of managing restrictions with workaround products like A800, a sudden H20 licensing requirement unveiled in April 2025 inflicted a $4.5B charge, completely blindsiding prior "alternative product" assurances. Only $60M in H20 revenue materialized under subsequent licenses.
Spin & Euphemism Patterns
- "Misaligned with demand": The FY2023 $2.17B charge is described as inventory provisions from "supply commitments misaligned with demand," softening a genuine forecasting error.
- "Complexity" as catch-all: Product transitions "are complex," supply chains bring "complexity," new vendors add "complexity." The word is deployed recurrently to frame execution challenges as inherent rather than indicating management shortfalls.
- "May" ubiquitous overload: Almost every risk disclosure is qualified with "may," distancing management from direct accountability. E.g., "may incur inventory provisions" became reality twice, but the language remains hypothetical.
- Export control framing: The $4.5B H20 charge is attributed to a "license requirement" rather than a failure to anticipate regulatory tightening; the narrative deflects responsibility toward USG action.
Credibility Grade (B)
Management has a strong record of delivering on product roadmaps, scaling supply, and overdelivering on growth targets-most promises are kept. However, two massive, demand-side blind spots (FY2023 inventory collapse and FY2026 H20 charge) demonstrate overconfidence in forecasting and geopolitical risk navigation, costing billions. They are consistently forthright about risks, but the size of those misses, especially when prior alternatives were publicly touted, prevents a top-tier grade. Overall: honest, with notable execution prowess, but not above making expensive, foreseeable errors in demand planning.
Management's tone across the four quarters is consistently and intensifyingly bullish - it never wavers from a confident posture of secular AI demand dominance. In November 2025, the refrain was "clouds are sold out" and a "fully utilized GPU installed base"; by February 2026, Jensen Huang distilled it to "compute equals revenues"; and in May 2026, the framing jumped to "Demand has gone parabolic. The reason is simple. Agentic AI has arrived." There's no pivot from growth investment to macro hedging - instead, the arc is from strong to explosive, with each call ratcheting up the urgency. The only mild caution surfaced around gross margins when Colette Kress noted in November that "input costs are on the rise but we are working to hold gross margins in the mid-seventies." This was presented transparently, and both subsequent quarters delivered margins at or above that range (75.2% non-GAAP in February, 75% in May), turning the caution into a track record of execution.
In Q&A, management meets hard questions with direct numerical answers or credible specificity rather than vision pivots. On China export constraints, Kress has been unambiguous across all four calls: "we are not assuming any data center compute revenue from China" (November 2025) and similar reiterations, never promising unwarranted recovery. When competitive threats are raised - LPX/SRAM accelerators - management didn't deflect; they dismissed them as "expected to remain niche" (May 2026). There are no quotes suggesting evasive language. The CFO, Colette Kress, is present on every call and handles operational and financial detail herself; there's no hand-off away from hard topics.
Confidence on guidance is undeniable. After comfortably beating the November-issued Q4 outlook of $65 billion with $68 billion, management raised Q1 FY2026 guidance to $78 billion, then delivered $82 billion - a $13.5 billion sequential record. The Q2 outlook at $91 billion implies another ~11% jump, with the CEO explicitly linking growth to Blackwell architecture throughput gains and agentic AI monetization. There is no blaming of external forces; instead, guidance lifts are tied to specific drivers like the 2.7x throughput boost on Blackwell Ultra or Vera Rubin's upcoming ramp.
Concrete, trackable commitments are plentiful. The May call promises "anticipated $20 billion in standalone CPU revenue for the year," VeraRubin "production shipments set to begin in Q3," and Q2 gross margin of 75% non-GAAP (±50 bps). It also commits to full-year OpEx growth "in the upper 40% range." These all become hard accountability markers. One minor shift: the February call flagged supply constraints as a Gaming headwind, but by May the narrative changed to "consumer demand softened due to higher memory and system costs" - not a broken promise but a different pressure. This doesn't detract from the overall pattern of clear, specific statements.
Net assessment: HONEST_AND_CONFIDENT. Management's tone is unflinchingly optimistic, yet it is grounded in repeatedly delivered beats, numerically precise guidance, and direct acknowledgment of the few genuine constraints (China, temporary input cost pressure). No red flags.
Quarterly trajectory
- Revenue over the past 8 periods shows extreme volatility: from $38.8B (Oct 2023) to $26.0B (Apr 2024) - a trough - then a sharp ramp to $91.2B (Oct 2024), a dip to $44.1B (Apr 2025) driven by a $4.5B H20 export charge, followed by record $147.8B (Oct 2025) and a 45% sequential decline to $81.6B (Apr 2026).
- Net income broadly tracks revenue but with amplified swings: Oct 2024 NI of $50.8B on $91.2B revenue (55.7% margin); Apr 2025 NI of $18.8B on $44.1B revenue (42.6% margin, depressed by the charge); Oct 2025 NI of $77.1B on $147.8B revenue (52.2% margin); Apr 2026 NI of $58.3B on $81.6B revenue (71.5% margin, unusually high).
- Operating cash flow (OCF) moved in sync with NI directionally but has been consistently lower in 6 of the last 8 periods. YoY in the latest quarter (Apr 2026 vs Apr 2025): revenue +85.3%, NI +210.7%, OCF +83.7% - the NI surge exaggerated by the low base from the H20 charge.
- Sequential trend (last 4 periods): Apr 2025 → Jul 2025 +106%, Jul 2025 → Oct 2025 +63%, Oct 2025 → Apr 2026 −45%. Momentum decelerated sharply in the latest period; the 45% sequential revenue drop is the largest single-quarter decline in the series.
- Outlier: The Oct 2025 quarter ($147.8B revenue) is a clear positive outlier - likely the peak of the Blackwell ramp and the strongest AI infrastructure demand period. The Apr 2025 quarter ($44.1B) is a negative outlier, artificially depressed by the $4.5B H20 charge.
Quality of earnings
NI exceeds OCF in 6 of 8 periods, with the gap widening in the two most recent: Oct 2025 NI $77.1B vs OCF $66.5B (gap $10.6B), and Apr 2026 NI $58.3B vs OCF $50.3B (gap $8.0B). The only quarters where OCF > NI were Apr 2024 (OCF $15.4B vs NI $14.9B) and Apr 2025 (OCF $27.4B vs NI $18.8B, thanks to the H20 charge creating a non-cash accrual). The persistent NI > OCF pattern suggests material non-cash items (e.g., stock-based compensation, depreciation) are not fully offset by working capital outflows, and that accruals are doing the heavy lifting. This is a WEAK earnings quality signal - the gap implies a buildup of receivables or inventory that may reverse.
Recent inflection
The single most important inflection point is the Oct 2024 → Apr 2025 transition. Revenue crashed from $91.2B to $44.1B (−51.6%) and NI from $50.8B to $18.8B (−63.0%). The cause was U.S. export restrictions on H20 products to China, which forced a $4.5B charge for excess inventory and purchase obligations. This event fundamentally reshaped the company's forward outlook, introducing regulatory dependency and a two-step revenue pattern: a depressed quarter followed by rapid recovery (Apr 2025 → Jul 2025 +106% and Oct 2025 records). Without the H20 charge, the trajectory would have been a smooth ramp from Oct 2024 to Oct 2025.
Forward read
Based on the Apr 2026 quarter - revenue $81.6B, NI $58.3B (71.5% margin), OCF $50.3B - the most probable next quarter (Jul 2026) should see a sequential rebound. Historical patterns show Apr quarters are trough quarters (Apr 2024 $26.0B, Apr 2025 $44.1B) followed by strong Jul quarters (+116% and +106% respectively). Assuming no new export actions and continued Blackwell Ultra (GB300) shipments, I'd expect revenue of ~$98B (YoY +8% vs Jul 2025's $90.8B) and a net income margin near 55%, yielding NI of ~$54B. Assumptions: (1) normal seasonality holds, (2) no major regulatory shocks, (3) product mix shifts toward higher-margin Blackwell platforms but not as extreme as Apr 2026's 71.5% margin (which likely included one-time benefits from mix or prior-period reversals). OCF should improve proportionally but remain below NI, likely ~$48B.
Risks the quarterly data flags
- Revenue volatility is extreme - the 45% sequential drop from Oct 2025 to Apr 2026 indicates demand lumpiness or product transition gaps. If this pattern repeats, a future quarter could see another sharp downswing, especially as the one-year product cadence (Blackwell → Rubin) creates natural troughs before new ramps. No guidance suggests a linear upward path.
- Operating cash flow has trailed net income for four consecutive quarters (Jul 2025 through Apr 2026), with the gap averaging $8.4B. This signals a growing reliance on accruals (e.g., accounts receivable or inventory build) that could reverse into cash outflows if demand softens. Working capital absorbed $16.1B cumulatively over the last two reported quarters.
- The H20 export incident created a $4.5B charge and a 51% revenue decline in a single quarter. With further product-specific licenses (H200) still generating no revenue as of Apr 2026, the regulatory environment remains a binary risk. Any new restriction on Blackwell or Rubin exports could trigger another sudden revenue gap and write-downs.
- Net income margin surged to 71.5% in Apr 2026, far above the 50-55% range of adjacent quarters. Such a high margin is unsustainable if mix normalizes or if R&D/marketing spend catches up. A margin reversion to ~55% would imply NI of $45B on the same Apr revenue - a $13B profit headwind in a single quarter.
The Moat
(Lightly edited from the Buffett analysis)
NVIDIA's CUDA ecosystem is the real moat. After two decades and $76.7 billion of cumulative R&D [10k-biz-2026-p1], the company has built an impregnable software‑hardware stack: millions of developers write code that only runs on NVIDIA GPUs, and switching means rewriting entire AI training pipelines. The Mellanox networking integration and the "systems" approach - co‑designing chips, interconnects, and libraries - create lock‑in that competitors cannot replicate quickly. In an inflationary world, the business has exhibited genuine pricing power: operating margins expanded from the high‑20s to over 60% [pc], and even at those levels hyperscalers pay up because there is no substitute at scale.
But moats are best measured in normal demand years, not in a once‑in‑a‑generation infrastructure build‑out. FY2023 proved the point: when revenue flatlined at $27 billion, operating income crashed 57.9% and ROIC crumbled to 11.2% [pc]. The same long‑lead‑time supply chain that enables the feast becomes the famine when demand softens, because NVIDIA must commit to supply 12‑plus months in advance. ROIC swings from 11.2% to 81.2% in three years [pc] - that standard deviation of 24.1 points tells you the business is cyclical, not a steady compounder. The moat is wide and deepening, but it does not insulate the company from the demand cycle. At $214, the market is pricing it as if it does.
What Could Go Wrong
(Lightly edited from the Klarman analysis)
At $214, there is no margin of safety. The base‑case intrinsic value is $96.83 [pc], and the worst plausible scenario - a product‑cycle lull combined with tightened export controls - could push IV to $30-$76 per share, a decline of 65-85% from today's quote [pc]. The $4.5B H20 charge in FY2026 is not an anomaly; it is a template. The regulatory trajectory is unbroken escalation: from narrow A100/H100 restrictions to an indefinite H20 license requirement that cratered revenue to $60 million [er]. The AI Diffusion IFR now captures virtually every data‑center GPU. A second write‑down on Blackwell or Rubin of $5-10 billion is plausible and priced into nothing.
Demand‑cycle risk is equally acute. FY2023 showed that flat revenue can produce a 57.9% operating‑income collapse because supply commitments become liabilities the moment demand cools [pc]. In FY2026, the latest quarter already printed -10.5% YoY revenue and a 45% sequential drop [quarterly]. The $17.5B venture portfolio - much of it in startups that purchase NVIDIA products - introduces a circular‑financing risk. In a credit event, those marks vanish. Forensic signals compound the danger: the Sloan accruals ratio is +10.9% [pc], meaning reported profits overstate cash earnings, and the Beneish M‑Score flags likely manipulation [pc]. With the CAPE at 42 and credit spreads at the 1st decile [macro], the market is complacent. NVIDIA is an extraordinary business at an impossible price; Klarman's rule is to wait for the seller to become desperate. That moment is not now.
Capital Allocation & Compounding
(Lightly edited from the Hohn analysis)
The CUDA moat passes the barriers‑to‑entry test, but the business fails the most critical Hohn criterion: predictable, essential, recurring cash flows. Revenue swings from $44 billion to $148 billion in adjacent quarters [quarterly]; free cash flow has a standard deviation that would make a long‑horizon holder tremble. The cash conversion cycle has stretched from 95 to 133 days [pc], and net income has exceeded operating cash flow for four consecutive quarters - accruals are doing the heavy lifting. The capital allocation decision of FY2026 - $17.5 billion into illiquid, non‑marketable venture investments, some of which "purchase our products directly" [10K‑MDA‑2026‑p1] - is a red flag of the highest order. It is a semiconductor company crossing into venture capital at the peak of an AI cycle, with the added risk of circular financing: NVIDIA's own investment capital may be inflating its reported revenue.
Compounding the problem: executive compensation lacks margin or return‑on‑capital metrics; CEO equity is tied to non‑GAAP operating income and TSR, while cash bonuses for other executives are tied solely to revenue [er]. Not margin. Not return on capital. Not free cash flow per share. That incentive design - together with the venture splurge - maximizes reported size, not per‑share value. The 5‑year net share reduction of 2.33% [pc] is modestly disciplined, but the direction of travel is wrong: capex nearly doubled to $6 billion [dp], and the marginal dollar of retained earnings is going into adventure, not into the core business at 50%+ incremental returns. A truly great business at an impossible price is still a pass.
Governance Quality
(Verbatim from the Governance Quality Report)
Executive Compensation
NVIDIA's Fiscal 2026 compensation program is overwhelmingly performance‑driven. According to the CD&A, 96% of CEO Jen‑Hsun Huang's total target pay is contingent upon corporate performance, with the remaining 4% consisting of base salary (the dollar amount of which is not disclosed in the provided excerpt). For other NEOs, the average at‑risk portion is 48% of total target pay. Actual payouts for the year hit the maximum possible under every plan as revenue ($215.9B), Non‑GAAP Operating Income ($137.3B), and three‑year TSR (100th percentile) all exceeded the CC's Stretch Compensation Plan goals.
The CEO receives no time‑based RSUs; his equity compensation consists entirely of SY PSUs (vesting over four years based on annual Non‑GAAP Operating Income) and MY PSUs (vesting over three years based on three‑year TSR relative to the S&P 500). The caps on his PSUs are deliberately lower (150% of target) than those for other NEOs (200%) to equalize total upside across the group. Other NEOs also receive variable cash awards tied to annual revenue. This structure directly links pay to metrics that drive long‑term shareholder value and avoids the short‑term focus that can arise from EPS‑only targets; the use of relative TSR and absolute operating income over multi‑year periods discourages buyback‑fueled manipulation.
Because the summarized compensation table excerpt provided in the filing does not include the actual dollar figures or pay‑ratio disclosure, I cannot report the CEO's absolute total compensation, the year‑over‑year change, or the CEO‑to‑median‑worker ratio. However, the compensation philosophy and design-capped payouts, no hedging/pledging, a clawback policy, and the absence of employment agreements, excise tax gross‑ups, or single‑trigger change‑in‑control vesting-demonstrate rigorous alignment with long‑term value creation.
Board Composition
The board consists of ten directors, nine of whom (90%) are independent under Nasdaq rules. Mr. Huang is the only management director. All committees-Audit (AC), Compensation (CC), and Nominating & Governance (NCGC)-are composed solely of independent directors, and each committee has an independent chair (A. Brooke Seawell for AC, Dawn Hudson for CC, Stephen C. Neal for NCGC). The proxy lists a "Lead Director" (Stephen C. Neal), which strongly implies that Mr. Huang serves as Chairman in addition to being President and CEO, though the excerpt does not explicitly state that he holds the Chairman title. A combined CEO/Chair role with a robust Lead Independent Director is common in founder‑led technology companies and, when balanced by an independent and active board, does not necessarily signal poor governance.
Several directors have exceptionally long tenures: Tench Coxe and Harvey C. Jones have served since 1993
Persona Deliberations
Each persona has now read the full draft thesis above and written a structured critique - what they agree with, what they push back on, and their bottom line. This is where each takes their stand.
Warren Buffett - Reading the Thesis
What I agree with
The thesis correctly dismantles the valuation. A base-case intrinsic value of $96.83 against a $214.22 price, a reverse-DCF implying 36.5% sustained growth, and a margin of safety that's deeply negative - the math is unequivocal. The earnings-quality flags are well-supported: the Sloan accruals ratio at +10.9%, four consecutive quarters of net income outpacing operating cash flow (cumulative $34.1B gap), and the cash conversion cycle stretching to 133 days. The single-metric revenue compensation plan is a genuine red flag, as is the $17.5B venture splurge with disclosed circular-financing risk - these destroy the capital-allocation discipline that compounding requires. The management credibility grading is fair: product execution is superb, but demand-forecasting optimism has produced two multibillion-dollar write-downs, and that pattern matters at a $5 trillion price tag.
What I'd push back on
The thesis underweights the actual durability of the moat through a cycle. FY2023 is cited as proof of fragility - ROIC fell to 11.2%, operating margin to 15.7% - but those figures still exceed any reasonable cost of capital and reflect an inventory-clearing event on essentially flat revenue. A business that never loses money in its worst recent year, while maintaining a positive return on tangible capital, has a real competitive advantage, not a temporary demand lift. The same CUDA lock-in and systems integration that drove 60%+ margins at the peak also kept the bottom from falling out. The stress-test scenarios (2008-replay IV of $30) imply the kind of bankruptcy risk that doesn't fit a net-cash, fabless firm whose chips are essential to modern computing. I'm not dismissing the price risk - at $214 the downside is enormous - but I'd frame the problem differently: the business is a potential long-term compounder, and the valuation is its only fatal flaw. The thesis's conclusion that "extraordinary business at an impossible price" is right, but the pushback sections sometimes blur the distinction between "this stock is dangerously overpriced" and "this business is too cyclical to own." At a sufficiently low price, I'd be a buyer.
I'd reverse my view on the business's competitive durability if operating margin drops below 30% for two consecutive quarters, excluding one-time regulatory or inventory charges, indicating the pricing-power moat has been structurally breached.
Seth Klarman - Reading the Thesis
What I agree with
The thesis correctly flags the deteriorating cash‑earnings gap as the most immediate warning. The Sloan accruals ratio of +10.9% - above the 10% danger line - and the persistent four‑quarter run where net income exceeds operating cash flow by a cumulative $34.1 B are real, not statistical noise. When a company reports $120 B of net income but converts only 81¢ of every dollar into free cash flow, and the cash conversion cycle has widened from 95 to 133 days, the reported profits are flattered by receivables and inventory that can reverse violently. The $4.5 B H20 charge is not an anomaly; it's a template. The thesis correctly treats it as a recurring feature of a business that must commit to supply 12‑plus months ahead, making inventory provisions structural. I also agree that the $17.5 B venture splurge - some of it into startups that "purchase our products directly" - raises the possibility of circular financing, which, if material, would mean a portion of reported revenue is self‑funded. That is a forensic flag of the highest order. Finally, management's single‑metric revenue‑based bonus is precisely the incentive that produces exactly the kind of illiquid, top‑line‑inflating behavior we are seeing. The numbers point to a cyclical infrastructure monopolist, not a compounder, and the thesis is right to treat the ROIC swing from 11.2% to 81.2% in three years as proof.
What I'd push back on
Where the thesis underestimates downside is in the severity of a genuine chip recession. The DCF bear case gives an IV of $79.20, only 18% below the base, yet semiconductor cycles routinely produce 50-70% earnings collapses. Look at FY2023: revenue was flat, not down, and operating margin still cratered from 37.3% to 15.7%. The latest quarter already shows a 45% sequential revenue drop and a -10.5% YoY figure. If revenue merely returns to FY2025's $130 B - a 40% decline from the FY2026 peak - and operating margins compress to the 10‑year average of 24.9%, net income would be roughly $32 B. At a 15× multiple, that is a $480 B market cap, or about $20 per share. Even that assumes no additional inventory write‑downs. If the AI demand wave proves to be an infrastructure overbuild, revenue could fall further and margins could turn negative, as the long‑lead‑time supply chain locks in costs. The EPV of $14.65 gives a reasonable lower bound on asset value absent growth - a 93% decline from the current $214. That's not a "stress test"; it's what happens when a capital‑intensive cyclical hits a down‑cycle with inflated receivables and $17.5 B of illiquid venture marks that get written down simultaneously. I'd reverse my view if NVIDIA delivers two consecutive quarters of positive sequential revenue growth with operating margins above 55%, and the Sloan accruals ratio drops below 5% for two quarters - demonstrating that cash earnings are catching up and demand is not evaporating. Until then, the earnings quality and trajectory are far too fragile.
My bottom line
AVOID. The margin of safety is nonexistent: at $214, the price is 2.2× a base‑case IV of $96.83 and over 15× the no‑growth EPV of $14.65. A reversion to mid‑cycle profitability implies a share price below $20, a permanent loss of 90% or more. The combination of extreme valuation, deteriorating cash‑flow quality, geopolitical write‑downs that have become structural, and a venture‑capital misallocation that may be disguising true organic demand makes this a permanent‑capital‑loss candidate. No business, no matter how wide its moat, is worth 2.2× a generously estimated intrinsic value when the cycle is rolling over.
Chris Hohn (TCI) - Reading the Thesis
What I agree with
The thesis correctly identifies the genuine lock-in from the CUDA ecosystem - millions of developers, decades of $76.7B cumulative R&D, and a system-level integration that creates real switching costs. That moat has produced a 10-year average ROIC of 32.7% and operating margins that expanded from 28% to over 60%, confirming pricing power well above inflation. The identification of the cyclical nature of those returns is also right: ROIC's 24.1-point standard deviation and the FY2023 collapse to 11.2% prove this is not a steady compounder. And I agree wholeheartedly on the capital allocation red flags - $17.5B deployed into illiquid startups with circular financing risk, and a compensation plan based solely on revenue, not on returns on capital, is a structural flaw that will erode per-share value over time.
What I'd push back on
For an 8+ year hold, the moat must be sustainable over a 30-year horizon, and here the thesis is too generous. The CUDA ecosystem is currently indispensable, but the rise of hyperscaler-designed ASICs (Google TPU, AWS Trainium) and open-source software frameworks could erode the installed-base advantage faster than the market appreciates. The thesis calls competitors "niche," but that is a forecast, not a structural fact; in semiconductors, software dependence has never been a permanent barrier - it just raises the cost and time of substitution. I'd need to see evidence that the switching costs are so high that even a 10-year decline in performance-per-dollar advantage would not cause defection. FY2023 was a warning: flat revenue produced a 57.9% operating-income crash, showing the business remains a cyclical equipment sale with a software wrapper, not a predictable annuity. Additionally, the deteriorating cash quality - Sloan accruals +10.9%, four straight quarters of NI > OCF - means reported profits overstate economic earnings, and true FCF is overstated by SBC that consumes 23.1% of reported FCF. For a long-term holder, the gap between accounting and cash is dangerous.
I'd reverse my view if, over the next five years, NVIDIA demonstrates that its AI infrastructure revenue is as predictable as enterprise-software subscriptions, with quarterly revenue variability within ±10% of a stable trend, and if free cash flow conversion consistently exceeds 90% of net income - proving the cash generation is truly durable and not merely an artifact of a demand spike.
My bottom line
PASS. The moat is real but its 30-year durability is uncertain; the business remains deeply cyclical (45% sequential revenue drops) with deteriorating cash conversion, and capital allocation is misaligned with per-share value creation. At 2.2× intrinsic value with a 36.5% implied growth rate, the price embeds perfection - I cannot underwrite an 8+ year holding with the conviction required to sleep at night. If the cycle breaks and the price falls to a level where the moat's sustainability can be bought at a true margin of safety, I'd re-evaluate.
Jim Chanos - Reading the Thesis
What I agree with
The thesis correctly surfaces genuine forensic flags. The Sloan accruals ratio of +10.9% - above the 10% danger line - and the cash conversion cycle stretching to 133 days, rising at 5.5 days per year [pc], are unambiguous signals that reported earnings are inflating economic reality. Over the last four quarters net income exceeded operating cash flow by a cumulative $34.1B [pc], meaning accruals are financing the P&L. The $17.5B venture splurge into illiquid startups, some of which "purchase our products directly" [10k-mda-2026-p1], is a capital‑allocation red flag straight out of the late‑1990s playbook - a semiconductor company turning into a venture fund at the peak of an AI hype cycle. Management's credibility grade (B) is fair, but the pattern is damning: two massive, multi‑billion‑dollar demand‑forecasting errors (FY2023 $2.17B charge, FY2026 $4.5B H20 charge) tied to exactly the external shocks (crypto, geopolitical) that a "wonderful business" should be able to weather. The single‑metric revenue compensation plan [er] aligns executives with top‑line size, not per‑share value, while the ROIC collapse from 81.2% to 54.3% [pc] tells you the capital‑light era is ending. The reverse‑DCF implied growth of 36.5% [pc] is a fantasy in a business whose latest quarter already printed -10.5% YoY revenue and a 45% sequential drop. The thesis didn't miss the bear signals - the forensic and late‑cycle evidence is all correctly flagged.
What I'd push back on
The analysis is still too soft on the short side. It acknowledges the circular‑financing risk but treats it as a "monitoring" item, when in fact it's the single most compelling reason this stock could be cut in half. NVIDIA's own filings disclose that the $17.5B venture portfolio includes startups that purchase NVIDIA products. That is not a passive investment; it is a mechanism to book revenue with capital that originated from NVIDIA's balance sheet. If even 8% of FY2026's $215.9B revenue is derived from these related‑party transactions, that's $17B of circular revenue - roughly the entire venture outlay. When the cycle turns, those marks vanish and the revenue reverse: the accruals that have been propping up net income (NI > OCF in six of eight quarters) will unwind violently. The cash conversion cycle already at 133 days will blow past 150 days as receivables and inventory mount while demand decelerates. The catalyst: within two quarters, the company misses its own guidance ($91B expected in Q2 FY2027) by 20%+ as a key cohort of venture‑backed customers cannot pay, forcing a $5-8B bad‑debt charge and a negative free‑cash‑flow quarter. The market will then reprice a name that it thought was a secular compounder as the cyclical, credit‑dependent story it actually is. The thesis underweights the forensic punch of the Sloan ratio; combined with the Beneish TATA of 0.084, this is not a benign growth artifact - it's a smoking gun for aggressive revenue recognition. I'd reverse my view if, within 12 months, the cash conversion cycle compresses below 100 days, the $17.5B portfolio yields a verified realized return of at least 10% with no impairments, and a clean quarter shows OCF exceeding net income by >10%.
My bottom line
SHORT_HIGH_CONVICTION · I would short with size. This is a classic late‑cycle semiconductor blow‑off - massive inventory build, channel stuffing via related‑party investments, forensic accrual flags at extremes, and a valuation that embeds 36% perpetual growth while actual revenue is already decelerating and swinging 45% intra‑year. The base‑case intrinsic value of $96.83 offers a 55% downside, and the stress‑test scenarios ($30-$76) imply a 65-85% collapse. The combination of earnings manipulation red flags and circular financing makes this one of the cleanest short setups I've seen in a decade.
Persona Rebuttals
Each persona has now read the other three's Phase 4.5 critiques and writes a focused rebuttal. This is where they engage with each other's reasoning, identify the strongest counter-arguments, and state whether any of them have changed their mind.
Warren Buffett - Rebuttal
Where the others sharpened my view
Chanos's quantification of the circular-financing risk has weight I had not fully assigned. He notes: "If even 8% of FY2026's $215.9B revenue is derived from these related‑party transactions, that's $17B of circular revenue - roughly the entire venture outlay." I flagged the $17.5B venture splurge originally, but I underestimated how that could inflate reported demand by a double-digit percentage. When the cycle turns, those marks may reverse, and the revenue they propped up can vanish alongside the assets. That makes the current price-embedding 36% perpetual growth-even more fragile. It sharpens my view that today's reported top-line is not all organic, and the true moat is harder to measure until that venture portfolio liquefies or fails.
Where I push back on the others
Hohn argues the business is "a cyclical equipment sale with a software wrapper, not a predictable annuity," and that ASICs plus open-source frameworks threaten the CUDA lock-in over a 30-year hold. I think that underrates how the moat held in FY2023. Revenue was essentially flat, yet operating margin never went negative-it bottomed at 15.7%. That's still well above a cost of capital, and it happened while the company was clearing inventory. The switching costs are not just software; they are the millions of engineer-hours sunk into CUDA optimization and the system-level integration that generic ASICs can't replicate for a broad range of workloads. Yes, there's cyclicality, but the right framework is to buy when the cycle makes the price wrong, not to conclude the business is unownable. My own reversal condition-operating margin below 30% for two consecutive quarters-directly tests the pricing-power moat. I'd need to see structural erosion, and FY2023 didn't deliver that.
Has my bottom line changed?
No change - WATCHLIST. My Phase 4.5 view was that this is a potential compounder with a durable moat, but the $214 price is impossible. The others' arguments about cash-quality deterioration, circular revenue, and downside severity reinforce why today's price embeds fantasy. But they don't turn me into a short because a 15.7% trough margin with a net-cash balance sheet is not a bankruptcy candidate - the EPV-of-$14.65 scenario requires assumptions that seem remote. I still wouldn't buy here; the margin of safety is negative. But at a price that reflects mid-cycle earnings, say a 15-18x multiple on $32B of normalized net income ($20-25 per share roughly), the business would be compelling. I'd rather wait for the cycle to deliver that price than bet against a platform that has already proven it can absorb a flat-revenue year without losing money.
Seth Klarman - Rebuttal
Where the others sharpened my view
Chanos crystallized the circular-financing risk with a precision I will not ignore. His quantification-that if even 8% of FY2026's $215.9 B revenue is sourced from venture-backed customers who are funded by NVIDIA's own $17.5 B portfolio, then the entire venture outlay becomes a revenue‑recognition engine-transforms a "monitoring item" into a hard catalyst. The scenario of a $5-8 B bad‑debt charge and a negative free‑cash‑flow quarter within two quarters, as those receivables fail, sharpens my downside timeline. Hohn also added a useful number: stock‑based compensation consumes 23.1% of reported free cash flow, meaning the true cash‑generation figure is materially lower than the base‑case model assumes. Together, these reinforce that the reported earnings are not just cyclically elevated-they embed circular flows that can reverse violently, widening my worst‑case drawdown from 90% to a near‑total loss of tangible equity if the receivables prove uncollectible.
Where I push back on the others
I must push hardest on Buffett's framing. He argues that "the business is a potential long‑term compounder, and the valuation is its only fatal flaw." That is precisely the thinking that leads permanent‑capital losses. A margin of safety is a specific number-30% or more below a conservatively derived intrinsic value-not an acknowledgment that the company never lost money in one mild down‑year. Even if the CUDA moat is unbreachable, a genuine semiconductor recession that takes revenue down 40% from the peak, with operating margins compressing to the ten‑year average of 24.9%, drives net income to roughly $32 B. At a 15× multiple on cycle‑depressed earnings, that is a $20 share price-a 90% permanent loss from today's $214. The FY2023 episode saw margins collapse to 15.7% on flat revenue; a top‑line decline would force negative operating income as long‑lead‑time inventory costs are locked in. The Sloan accruals ratio at +10.9% tells me that even the $96.83 base‑case IV overstates economic value because it is built on earnings that are part phantom. Buffett's willingness to own the business at "a sufficiently low price" is irrelevant when that price is not within 50% of fair value, and the potential downside makes the base case itself a moving target.
Has my bottom line changed?
No. This remains an AVOID. The forensic flags and circular‑revenue risk make the downside not merely severe but potentially catastrophic. I would only consider accumulating if the stock trades at $67 or below-a 30% discount to my already‑stressed base‑case intrinsic value of $96.83-and then only after the Sloan ratio falls below 5% for two consecutive quarters, confirming cash earnings are catching up to reported profits. At $214, the margin of safety is deeply negative, and no amount of moat‑quality rhetoric can change that arithmetic.
Chris Hohn (TCI) - Rebuttal
Where the others sharpened my view
Chanos's forensic specifics force me to see the capital-allocation rot as deeper than I initially credited. He points out that "if even 8% of FY2026's $215.9B revenue is derived from these related-party transactions, that's $17B of circular revenue - roughly the entire venture outlay." That crystallizes a direct link between the $17.5B venture splurge and top-line inflation, making the misalignment not just a red flag but a potential overstatement of organic moat strength. Klarman's decomposition of the cash conversion cycle's persistent widening - 133 days, rising 5.5 days per year - adds a structural dimension to the earnings-quality decay I flagged; it isn't a one-time inventory blip but a steady financing of the P&L. Buffett's observation that FY2023's trough ROIC of 11.2% still exceeded any reasonable cost of capital is a reminder that the moat's floor is solid, even if its stability over 30 years is uncertain. I underweighted that resilience: a business that retains pricing power and positive returns through a severe inventory correction has an advantage that is real, if not perfectly enduring.
Where I push back on the others
Buffett frames the problem as "valuation is its only fatal flaw," suggesting the business is a potential compounder. That is precisely the anti-list posture I refuse. For an 8+ year hold, I require structural barriers so obvious I can sleep through any technology shift. The CUDA lock-in is genuine, but hyperscaler ASICs and open-source frameworks are not niche - they attack the very installed-base advantage that drives the 60%+ margins. If the moat were truly 30-year durable, I'd accept a cyclical chop; but the 45% sequential revenue drops and the 57.9% operating-income collapse in FY2023 show that the business remains a chip sale with a software wrapper, not a predictable annuity. Chanos's shortsightedness on the moat's survivability misses my point: I'm not betting against survival, I'm demanding compounding predictability. A business can be too cyclical and technology-threatened to compound per-share value for a decade, even if it never goes to zero. Chanos may be right about a near-term unwind, but shorting a real-moat business with AI optionality is not a game I play. The structural barrier is real enough to avoid permanent capital loss for a long-only holder at the right price, but not reliable enough for me to underwrite 30-year compounding at any price today.
Has my bottom line changed?
PASS remains. The others have not surfaced evidence that moves the moat from cyclical, contestable-advantage to 30-year structural certainty. I need five-plus years of accelerating moat metrics - quarterly revenue variability within ±10% of a stable trend, free cash flow conversion above 90% of net income, and market-share stability as ASICs and open frameworks mature - before I'd even consider ACCUMULATE. A price decline alone is not a signal; only sustained evidence that the business behaves like a subscription-compounder, not a credit-linked equipment cycle, would shift my non-negotiable bar.
Jim Chanos - Rebuttal
Where the others sharpened my view
Klarman's arithmetic on a genuine chip recession - revenue returning to $130B, operating margins compressing to 24.9%, net income of roughly $32B, and a 15× multiple producing a $20 per share outcome - forces a recalibration. My base‑case $96.83 already looked generous; Klarman shows the margin for error on the short is far wider than even I credited. His EPV of $14.65 confirms that absent a growth miracle, the equity is a call option on narrative. Buffett's own instinct to run - "at a sufficiently low price, I'd be a buyer" - is the ultimate validation: the market's beacon of moat investing won't touch this at 2.2× intrinsic value. Both of them, through different lenses, reinforce that the price is not just expensive; it's structurally mispriced.
Where I push back on the others
Buffett's defence - "a business that never loses money in its worst recent year, while maintaining a positive return on tangible capital, has a real competitive advantage" - sidesteps the quality of those reported profits. FY2023's "worst year" printed $4.4
Catalysts to watch
Specific upcoming events that could change this thesis. When the date arrives, re-run the analysis to surface what moved.
| Date | Title | Tests | Category |
|---|---|---|---|
| August 2026 | Q2 FY2027 earnings release | Top-line growth trajectory (kill criterion if YoY growth negative again); operating margin trend; cash conversion cycle movement | earnings |
| March 2027 | GTC 2027 (GPU Technology Conference) | Demand outlook for next product cycle; competitive positioning vs hyperscaler ASICs; capital intensity implications | guidance |
| November 2026 | Q3 FY2027 earnings release | Revenue growth rate vs prior-year Blackwell ramp; inventory days and reserve risk | earnings |
| March 2027 | FY2027 10-K filing (annual report) | ROIC trajectory; Sloan accruals ratio; venture investment impairment risk; circular financing disclosures | other |
| Q1 2027 | BIS export control rule update (possible) | Geopolitical risk kill criterion; $5.5B H20 charge precedent for future write-downs | regulatory |
Detail
- Q2 FY2027 earnings release (August 2026) - First full quarter after H20 charge and Blackwell ramp; tests whether revenue growth stabilizes and operating margin resumes compression or expands.
- Source:
[pc][quarterly]
- Source:
- GTC 2027 (GPU Technology Conference) (March 2027) - Major product roadmap event expected to unveil Rubin architecture details, new data-center GPU generations, and AI platform updates.
- Source:
[10k-mda-2026-p1][cred]
- Source:
- Q3 FY2027 earnings release (November 2026) - Reports quarter including potential first Rubin-related revenue; tests sustainability of Blackwell volume and margin in a maturing product cycle.
- Source:
[pc][quarterly]
- Source:
- FY2027 10-K filing (annual report) (March 2027) - Provides audited full-year financials and MD&A; reveals capital allocation outcomes including any mark-to-market on $17.5B venture portfolio.
- Source:
[10k-mda-2026-p1][pc]
- Source:
- BIS export control rule update (possible) (Q1 2027) - Potential revision to AI Diffusion IFR or H20 license policy; could expand or contract restrictions on data-center GPU exports to China.
- Source: [events report]
What each investor would say
Four lenses on the same business.
Chanos
The Bear · moderate short convictionWhat I agree with
The thesis correctly surfaces genuine forensic flags. The Sloan accruals ratio of +10.9% — above the 10% danger line — and the cash conversion cycle stretching to 133 days, rising at 5.5 days per year [pc], are unambiguous signals that reported earnings are inflating economic reality. Over the last four quarters net income exceeded operating cash flow by a cumulative $34.1B [pc], meaning accruals are financing the P&L. The $17.5B venture splurge into illiquid startups, some of which “purchase our products directly” [10k-mda-2026-p1], is a capital‑allocation red flag straight out of the late‑1990s playbook — a semiconductor company turning into a venture fund at the peak of an AI hype cycle. Management’s credibility grade (B) is fair, but the pattern is damning: two massive, multi‑billion‑dollar demand‑forecasting errors (FY2023 $2.17B charge, FY2026 $4.5B H20 charge) tied to exactly the external shocks (crypto, geopolitical) that a “wonderful business” should be able to weather. The single‑metric revenue compensation plan [er] aligns executives with top‑line size, not per‑share value, while the ROIC collapse from 81.2% to 54.3% [pc] tells you the capital‑light era is ending. The reverse‑DCF implied growth of 36.5% [pc] is a fantasy in a business whose latest quarter already printed –10.5% YoY revenue and a 45% sequential drop. The thesis didn’t miss the bear signals — the forensic and late‑cycle evidence is all correctly flagged.
What I’d push back on
The analysis is still too soft on the short side. It acknowledges the circular‑financing risk but treats it as a “monitoring” item, when in fact it’s the single most compelling reason this stock could be cut in half. NVIDIA’s own filings disclose that the $17.5B venture portfolio includes startups that purchase NVIDIA products. That is not a passive investment; it is a mechanism to book revenue with capital that originated from NVIDIA’s balance sheet. If even 8% of FY2026’s $215.9B revenue is derived from these related‑party transactions, that’s $17B of circular revenue — roughly the entire venture outlay. When the cycle turns, those marks vanish and the revenue reverse: the accruals that have been propping up net income (NI > OCF in six of eight quarters) will unwind violently. The cash conversion cycle already at 133 days will blow past 150 days as receivables and inventory mount while demand decelerates. The catalyst: within two quarters, the company misses its own guidance ($91B expected in Q2 FY2027) by 20%+ as a key cohort of venture‑backed customers cannot pay, forcing a $5–8B bad‑debt charge and a negative free‑cash‑flow quarter. The market will then reprice a name that it thought was a secular compounder as the cyclical, credit‑dependent story it actually is. The thesis underweights the forensic punch of the Sloan ratio; combined with the Beneish TATA of 0.084, this is not a benign growth artifact — it’s a smoking gun for aggressive revenue recognition. I’d reverse my view if, within 12 months, the cash conversion cycle compresses below 100 days, the $17.5B portfolio yields a verified realized return of at least 10% with no impairments, and a clean quarter shows OCF exceeding net income by >10%.
My bottom line
SHORT_HIGH_CONVICTION · I would short with size. This is a classic late‑cycle semiconductor blow‑off — massive inventory build, channel stuffing via related‑party investments, forensic accrual flags at extremes, and a valuation that embeds 36% perpetual growth while actual revenue is already decelerating and swinging 45% intra‑year. The base‑case intrinsic value of $96.83 offers a 55% downside, and the stress‑test scenarios ($30–$76) imply a 65–85% collapse. The combination of earnings manipulation red flags and circular financing makes this one of the cleanest short setups I’ve seen in a decade.
Buffett
What I agree with
The thesis correctly dismantles the valuation. A base-case intrinsic value of $96.83 against a $214.22 price, a reverse-DCF implying 36.5% sustained growth, and a margin of safety that’s deeply negative – the math is unequivocal. The earnings-quality flags are well-supported: the Sloan accruals ratio at +10.9%, four consecutive quarters of net income outpacing operating cash flow (cumulative $34.1B gap), and the cash conversion cycle stretching to 133 days. The single-metric revenue compensation plan is a genuine red flag, as is the $17.5B venture splurge with disclosed circular-financing risk – these destroy the capital-allocation discipline that compounding requires. The management credibility grading is fair: product execution is superb, but demand-forecasting optimism has produced two multibillion-dollar write-downs, and that pattern matters at a $5 trillion price tag.
What I’d push back on
The thesis underweights the actual durability of the moat through a cycle. FY2023 is cited as proof of fragility – ROIC fell to 11.2%, operating margin to 15.7% – but those figures still exceed any reasonable cost of capital and reflect an inventory-clearing event on essentially flat revenue. A business that never loses money in its worst recent year, while maintaining a positive return on tangible capital, has a real competitive advantage, not a temporary demand lift. The same CUDA lock-in and systems integration that drove 60%+ margins at the peak also kept the bottom from falling out. The stress-test scenarios (2008-replay IV of $30) imply the kind of bankruptcy risk that doesn’t fit a net-cash, fabless firm whose chips are essential to modern computing. I’m not dismissing the price risk – at $214 the downside is enormous – but I’d frame the problem differently: the business is a potential long-term compounder, and the valuation is its only fatal flaw. The thesis’s conclusion that “extraordinary business at an impossible price” is right, but the pushback sections sometimes blur the distinction between “this stock is dangerously overpriced” and “this business is too cyclical to own.” At a sufficiently low price, I’d be a buyer.
I’d reverse my view on the business’s competitive durability if operating margin drops below 30% for two consecutive quarters, excluding one-time regulatory or inventory charges, indicating the pricing-power moat has been structurally breached.
Hohn
What I agree with
The thesis correctly identifies the genuine lock-in from the CUDA ecosystem — millions of developers, decades of $76.7B cumulative R&D, and a system-level integration that creates real switching costs. That moat has produced a 10-year average ROIC of 32.7% and operating margins that expanded from 28% to over 60%, confirming pricing power well above inflation. The identification of the cyclical nature of those returns is also right: ROIC’s 24.1-point standard deviation and the FY2023 collapse to 11.2% prove this is not a steady compounder. And I agree wholeheartedly on the capital allocation red flags — $17.5B deployed into illiquid startups with circular financing risk, and a compensation plan based solely on revenue, not on returns on capital, is a structural flaw that will erode per-share value over time.
What I’d push back on
For an 8+ year hold, the moat must be sustainable over a 30-year horizon, and here the thesis is too generous. The CUDA ecosystem is currently indispensable, but the rise of hyperscaler-designed ASICs (Google TPU, AWS Trainium) and open-source software frameworks could erode the installed-base advantage faster than the market appreciates. The thesis calls competitors “niche,” but that is a forecast, not a structural fact; in semiconductors, software dependence has never been a permanent barrier — it just raises the cost and time of substitution. I’d need to see evidence that the switching costs are so high that even a 10-year decline in performance-per-dollar advantage would not cause defection. FY2023 was a warning: flat revenue produced a 57.9% operating-income crash, showing the business remains a cyclical equipment sale with a software wrapper, not a predictable annuity. Additionally, the deteriorating cash quality — Sloan accruals +10.9%, four straight quarters of NI > OCF — means reported profits overstate economic earnings, and true FCF is overstated by SBC that consumes 23.1% of reported FCF. For a long-term holder, the gap between accounting and cash is dangerous.
I’d reverse my view if, over the next five years, NVIDIA demonstrates that its AI infrastructure revenue is as predictable as enterprise-software subscriptions, with quarterly revenue variability within ±10% of a stable trend, and if free cash flow conversion consistently exceeds 90% of net income — proving the cash generation is truly durable and not merely an artifact of a demand spike.
My bottom line
PASS. The moat is real but its 30-year durability is uncertain; the business remains deeply cyclical (45% sequential revenue drops) with deteriorating cash conversion, and capital allocation is misaligned with per-share value creation. At 2.2× intrinsic value with a 36.5% implied growth rate, the price embeds perfection — I cannot underwrite an 8+ year holding with the conviction required to sleep at night. If the cycle breaks and the price falls to a level where the moat’s sustainability can be bought at a true margin of safety, I’d re-evaluate.
Klarman
What I agree with
The thesis correctly flags the deteriorating cash‑earnings gap as the most immediate warning. The Sloan accruals ratio of +10.9% — above the 10% danger line — and the persistent four‑quarter run where net income exceeds operating cash flow by a cumulative $34.1 B are real, not statistical noise. When a company reports $120 B of net income but converts only 81¢ of every dollar into free cash flow, and the cash conversion cycle has widened from 95 to 133 days, the reported profits are flattered by receivables and inventory that can reverse violently. The $4.5 B H20 charge is not an anomaly; it’s a template. The thesis correctly treats it as a recurring feature of a business that must commit to supply 12‑plus months ahead, making inventory provisions structural. I also agree that the $17.5 B venture splurge — some of it into startups that “purchase our products directly” — raises the possibility of circular financing, which, if material, would mean a portion of reported revenue is self‑funded. That is a forensic flag of the highest order. Finally, management’s single‑metric revenue‑based bonus is precisely the incentive that produces exactly the kind of illiquid, top‑line‑inflating behavior we are seeing. The numbers point to a cyclical infrastructure monopolist, not a compounder, and the thesis is right to treat the ROIC swing from 11.2% to 81.2% in three years as proof.
What I’d push back on
Where the thesis underestimates downside is in the severity of a genuine chip recession. The DCF bear case gives an IV of $79.20, only 18% below the base, yet semiconductor cycles routinely produce 50–70% earnings collapses. Look at FY2023: revenue was flat, not down, and operating margin still cratered from 37.3% to 15.7%. The latest quarter already shows a 45% sequential revenue drop and a –10.5% YoY figure. If revenue merely returns to FY2025’s $130 B — a 40% decline from the FY2026 peak — and operating margins compress to the 10‑year average of 24.9%, net income would be roughly $32 B. At a 15× multiple, that is a $480 B market cap, or about $20 per share. Even that assumes no additional inventory write‑downs. If the AI demand wave proves to be an infrastructure overbuild, revenue could fall further and margins could turn negative, as the long‑lead‑time supply chain locks in costs. The EPV of $14.65 gives a reasonable lower bound on asset value absent growth — a 93% decline from the current $214. That’s not a “stress test”; it’s what happens when a capital‑intensive cyclical hits a down‑cycle with inflated receivables and $17.5 B of illiquid venture marks that get written down simultaneously. I’d reverse my view if NVIDIA delivers two consecutive quarters of positive sequential revenue growth with operating margins above 55%, and the Sloan accruals ratio drops below 5% for two quarters — demonstrating that cash earnings are catching up and demand is not evaporating. Until then, the earnings quality and trajectory are far too fragile.
My bottom line
AVOID. The margin of safety is nonexistent: at $214, the price is 2.2× a base‑case IV of $96.83 and over 15× the no‑growth EPV of $14.65. A reversion to mid‑cycle profitability implies a share price below $20, a permanent loss of 90% or more. The combination of extreme valuation, deteriorating cash‑flow quality, geopolitical write‑downs that have become structural, and a venture‑capital misallocation that may be disguising true organic demand makes this a permanent‑capital‑loss candidate. No business, no matter how wide its moat, is worth 2.2× a generously estimated intrinsic value when the cycle is rolling over.
Kill criteria
If any of these triggers, the thesis is dead — exit, don't average down.
- Beneish M-Score above manipulation threshold
- High accruals ratio (10.9%)
- Circular financing via venture investments
- Latest quarter YoY revenue decline -10.5%
- Negative operating leverage despite revenue growth
Macro calibration
Elevated market valuations (CAPE 42, Buffett indicator 229.6%) and late-cycle complacency reinforce caution; waiting for a price closer to intrinsic value or macro correction aligns with capital preservation.
More sample theses
Browse the full sample library.
Now run your own.
Type a US ticker. Thirty minutes later, you receive the same kind of thesis we just showed you for NVDA — fact-checked, kill-criteria named, intrinsic value triangulated.
First thesis free · no card required