Want one of these for the company you're actually watching?
Free first thesis. No card. Thirty minutes from ticker to inbox.
At what price would the agents act?
Full thesis
Palantir Technologies Inc. (PLTR) — Investment Thesis
May 26, 2026
Summary
| Metric | Value |
|---|---|
| Verdict | Pass · moderate conviction · Quality 7/10 |
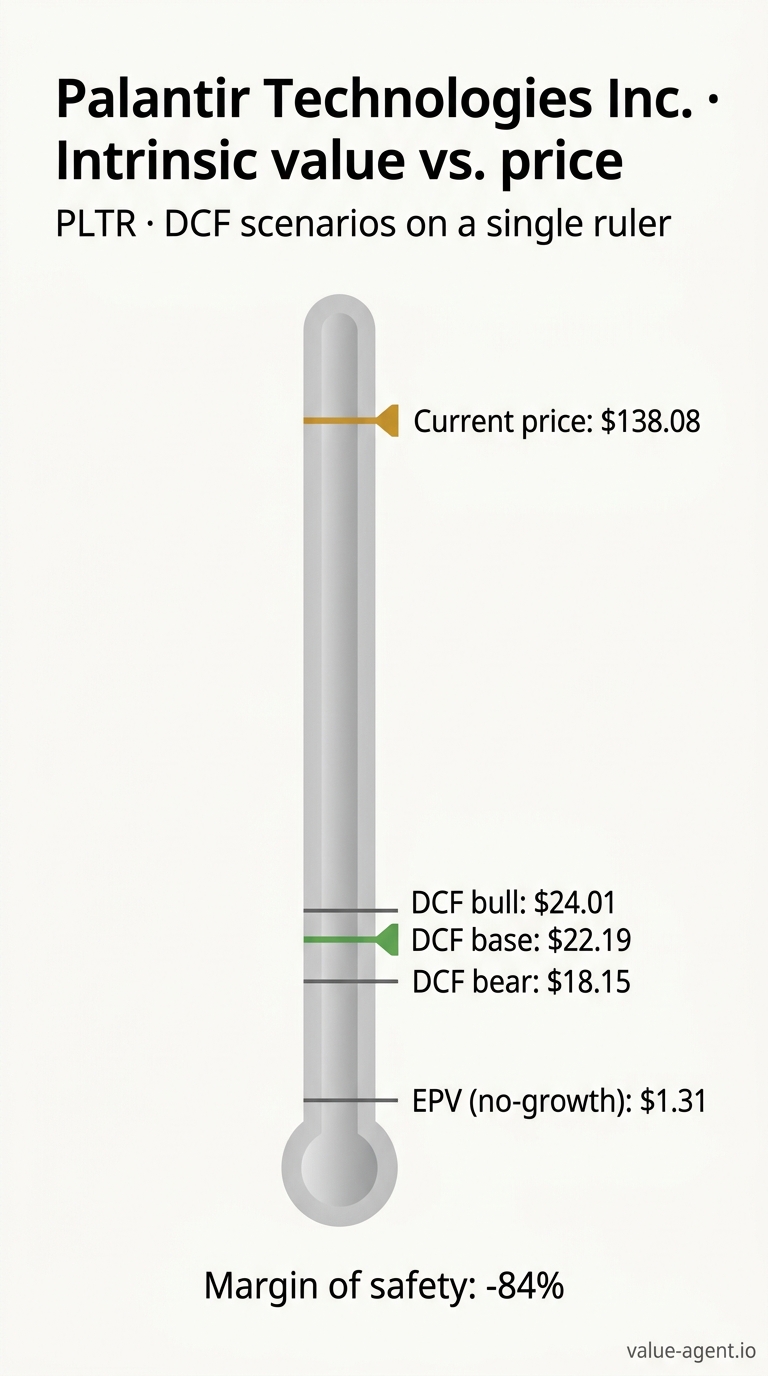
| Current price | $138.08 |
| IV (DCF Bear / Base / Bull) | $18.15 / $22.19 / $24.01 |
| IV (EPV) | $1.31 |
| Margin of Safety @ Base | price is 6.2× intrinsic value |
| Reverse-DCF implied growth | +50.0% |
| Latest FCF | $2,101M |
| FCF 5yr CAGR | n/a |
| Revenue 5yr CAGR | +32.6% |
| Latest ROIC | n/a |
| ROIC 10yr avg | n/a |
| Macro | CAPE 42.0 · 10Y 4.57% · Buffett indicator 229.6% |
| Management Credibility | B |
The Business in One Paragraph
Palantir builds software platforms — Gotham, Foundry, Apollo, and AIP — that help organizations integrate their data, decisions, and operations. Its roots are in the U.S. intelligence community, but today roughly 60% of its $11.2 billion remaining deal value comes from commercial customers [10k-mda-2026-p1]. The platforms embed deep inside a customer’s workflows via an “Ontology” that maps data, logic, and actions into shared infrastructure, making switching extremely costly. Palantir is asset-light, debt-free, and riding the AI adoption wave. It passes our circle-of-competence screen because its revenue model is recurring and its platforms have been in production for over two decades.
Financial Analyst Deep Dive
Financial Analyst Report — Palantir Technologies Inc. (PLTR)
Date: 2026-05-26 | Price: $138.08 | Market Cap: $317B | DCF Base IV: $22.19 | MoS: –522.2%
The 10-Year Story in One Paragraph
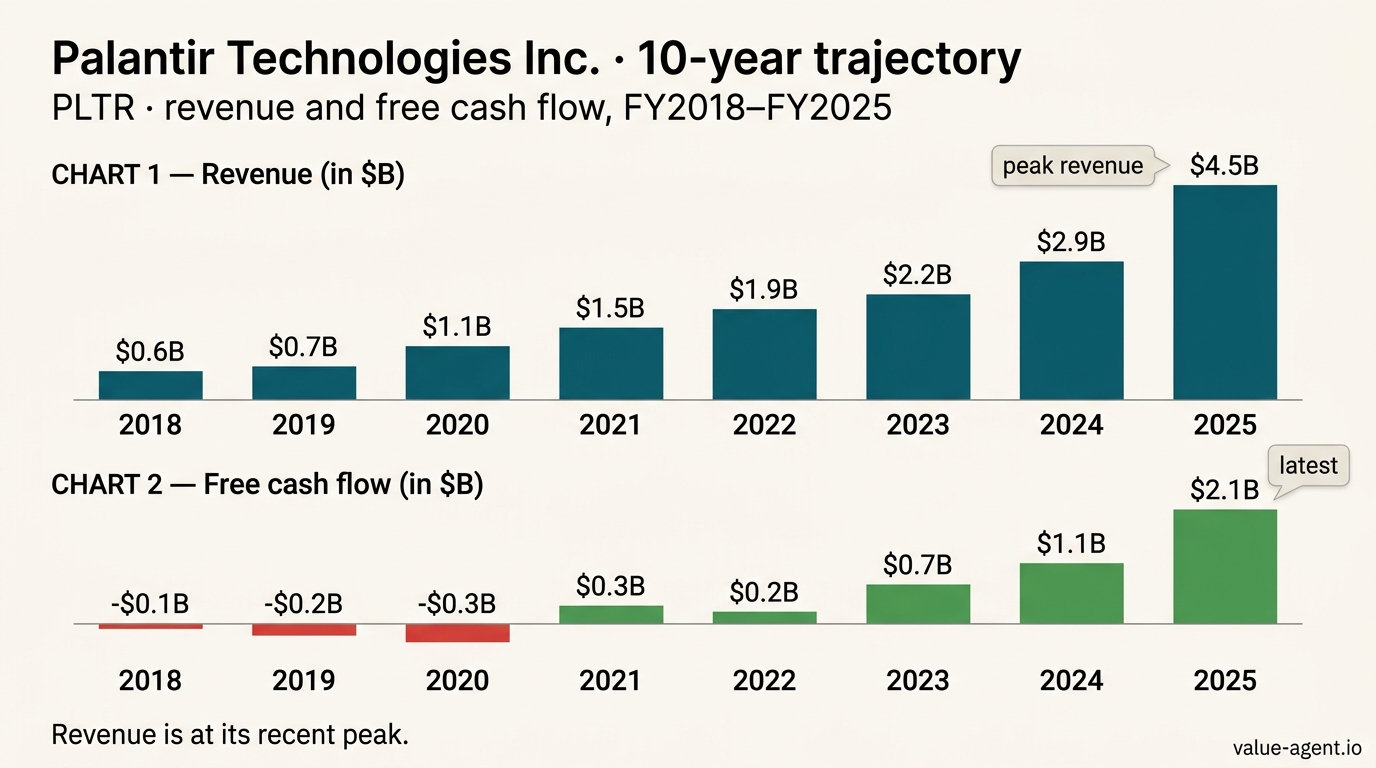
Palantir has executed one of the most dramatic operational turnarounds in enterprise software: from burning $1.17B of operating losses in 2020 to printing a 31.6% operating margin and $2.1B of free cash flow in FY2025 [pc]. The business itself is genuinely excellent — capital-light, debt-free, and riding the AI adoption wave with a commercial backlog ($6.8B) that has now eclipsed government ($4.4B) [10k-mda-2026-p1]. But the stock at $138.08 prices in nothing short of perfection: our reverse-DCF model clips at the +50% upper bound, meaning the market is implying growth beyond what any reasonable DCF can solve for — this is the strongest signal of overvaluation our framework can produce [pc]. The DCF base case yields $22.19 per share; even the bull case reaches only $24.01 [pc]. Meanwhile, shareholders have been diluted by +135.8% cumulatively, stock-based compensation averages 142% of reported free cash flow, and accounts receivable days have nearly doubled from 45 to 85 days over five years [pc]. What we have is a wonderful business with a terrible stock price.
Top-Line Trajectory
Revenue has compounded at 32.9% over three years and 32.6% over five years [pc] — a trajectory that puts Palantir in rarefied company. The path has not been linear: growth decelerated from +47.2% in 2020 to a trough of +16.7% in 2023, prompting genuine questions about whether the TAM was smaller than advertised [pc]. Then came the re-acceleration: +28.8% in 2024, followed by a blistering +56.2% in 2025 to reach $4,475M [dp, pc]. The inflection at +27.4pp between 2024 and 2025 is the single most important revenue signal — it marked the moment when AIP and commercial adoption shifted from potential to realized demand [pc].
But this is where the story gets fragile. TTM revenue stands at $7,473M — a figure that already reflects FY2025 annualizing at nearly double the prior run-rate [pc]. The most recent quarter (Q1 2026, ending March 31) printed -19.9% YoY, a staggering 52.5pp below the 5-year CAGR [pc]. The quarterly data confirm the seasonal pattern is real: Q3 2025 revenue of $3.07B was 88% higher than Q1 2025, and Q1 2026 revenue of $1.63B represents a 47% sequential drop from Q3 2025 [quarterly]. Management itself warns that "a large portion of our sales" close in the final weeks of each quarter and that "the loss or delay of one or more large sales transactions in a quarter would impact our results" [10k-mda-2026-p1].
The segment mix has shifted decisively toward commercial: commercial remaining deal value reached $6.8B at year-end 2025 (+117% YoY), compared to government at $4.4B (+90%) [10k-mda-2026-p1]. This is the validation of the thesis that Foundry and AIP could transcend their intelligence-community origins. The $11.2B total remaining deal value, up 105% from $5.4B in 2024 [10k-risk-2026-p1], is the raw material for future revenue — but every single 10-K warns that Palantir "historically has not realized all of the revenue from the full deal value" and that contracts are "subject to termination for convenience provisions" [10k-mda-2026-p1]. The market is clearly pricing as if nearly all of it converts; history and the company's own language suggest otherwise.
Profitability Evolution
The margin story is extraordinary by any standard. Operating margin traced a path from -107.4% (2020) to -26.7% (2021) to -8.5% (2022) to +5.4% (2023) to +10.8% (2024) to +31.6% (2025) [pc]. The slope across the full series is +20.87pp per year [pc]. FY2025 alone saw a +20.8pp expansion — the largest single-year jump in the dataset, and it came on +56.2% revenue growth, confirming the operating leverage in this model [pc].
What drove this? The MD&A narrative has consistently emphasized that "a substantial portion of our expenses are relatively fixed in the short term" [10k-mda-2025-p1]. When revenue surged, costs did not follow proportionally. R&D, sales infrastructure, and platform maintenance are largely sunk — incremental revenue dollars fell straight to the operating line. This is the dream of every software investor, and Palantir delivered it in FY2025.
The danger is the mirror image of that fixed-cost structure. Management warns with unusual candor that "our results of operations and liquidity would suffer if revenue fell below our expectations" [10k-mda-2026-p1]. At a 31.6% operating margin, a $1B revenue shortfall would vaporize roughly $316M of operating income, all else equal. The quarterly data already hint at margin vulnerability: Q1 2026 net income margin of 53.4% is likely unsustainable given that prior Q1 margins were 24.2% (2025) and 16.7% (2024) [quarterly]. If margins mean-revert even partially from these extraordinary levels, the earnings multiple embedded in the current stock price becomes even more indefensible.
Net income reached $1,625M in FY2025 (+251.6% YoY), and the quality of those earnings is strong by conventional measures — cash flow from operations exceeded net income in every quarter of the last eight quarters, with a median NI-to-OCF ratio of 69% [quarterly]. But conventional measures don't capture the stock-based compensation burden, which I address below.
Returns on Capital
ROIC data is unavailable in the pre-computed metrics — the series returns n/a across all windows, with zero years above 15% or 20% [pc]. This absence is itself informative. For much of Palantir's history, the company was deeply unprofitable, making ROIC negative or meaningless. Now that the business generates $1.6B in net income against an equity base of $7.4B (FY2025) [dp], the current-year ROIC is roughly 22% — competitive with top-tier software companies. But we lack the historical ROIC data to assess whether the moat is widening or merely experiencing a cyclical upswing.
What we can observe: Palantir's asset-light model (capex of just $34M in FY2025 against $4.5B of revenue — a 0.76% capex-to-revenue ratio [dp]) means invested capital is modest. The moat, if it exists, is not capital-intensive; it resides in the Ontology, the government security clearances and relationships, the multi-year deployment stickiness, and the network effects of shared data infrastructure across customers. The commercial remaining deal value overtaking government [10k-mda-2026-p1] suggests the moat is widening into new domains, but the 85-day AR collection period (up from 45 days in 2021) [pc] hints at deteriorating bargaining power — a widening moat should produce tighter, not looser, payment terms.
Cash Flow Quality
Headline free cash flow is impressive: $2,101M in FY2025, up 84.1% YoY, with a 3-year FCF CAGR of +125.3% [pc]. The FCF-to-NI conversion ratio averages 2.36x (median 2.47x) [pc], meaning Palantir generates more than $2 of free cash for every dollar of reported net income. This is the hallmark of a business with favorable working-capital dynamics, low capex requirements, and genuine cash-earning power.
But there is a gaping hole in this picture, and it has been present since the earliest years of our data: stock-based compensation averages 142.2% of reported FCF [pc]. This is not a rounding error. It means that over the full period, every dollar of "free cash flow" was more than matched by equity grants to employees — grants that dilute existing owners. The pre-computed true FCF after SBC series tells the real story:
| Year | Reported FCF | True FCF After SBC |
|---|---|---|
| 2021 | $321M | –$457M |
| 2022 | $184M | –$381M |
| 2023 | $697M | $221M |
| 2024 | $1,141M | $450M |
| 2025 | $2,101M | $1,417M |
Only in FY2025 did true FCF after SBC reach a level ($1,417M) that meaningfully exceeds what most companies would consider genuine surplus [pc]. This is progress — the ratio of SBC to FCF is improving as the denominator grows — but the cumulative damage is done. Shares outstanding expanded from 1,088M (2018) to 2,565M (2025), a +135.8% increase [pc, dp]. Over the trailing five years alone, dilution is +30.97% [pc]. Every per-share metric touted by management must be discounted by roughly one-third to reflect what the owner actually owns.
The Sloan accruals ratio of -6.7% (3-year average -10.7%) falls within normal range [pc], and the Piotroski F-Score of 7/9 signals strong financial health [pc]. There are no accruals shenanigans — the accounting is clean, audited by EY since 2008 with an unqualified opinion and effective internal controls [10k-fs-2026-p1]. The cash flow quality problem isn't accounting fiction; it's economic fiction — reported FCF counts equity compensation as costless when it is anything but.
A secondary concern: accounts receivable days have stretched from 45 (2021) to 49 (2022) to 60 (2023) to 73 (2024) to 85 (2025) [pc]. This is a five-year near-doubling. Simultaneously, AP days collapsed from 81 to 4 days over the same period [pc]. These are not the working-capital dynamics of a company with overwhelming bargaining power — they resemble a business that is funding its customers (extending looser payment terms to close deals) while its suppliers demand cash upfront. The $1,451M cash balance at year-end 2025, down from $2,120M in 2024 despite $2.1B of FCF [dp], may partly reflect this working-capital consumption. It's not a crisis — the company is debt-free and liquid — but it's a deterioration that contradicts the "partners can't live without us" narrative.
Capital Allocation Grade (A–F)
Grade: C
The defense:
Palantir eliminated all debt by FY2021 and has maintained a pristine balance sheet ever since [dp]. The company has $950M in undrawn credit capacity — a revolver and a delayed-draw term loan — providing a liquidity backstop that costs essentially nothing [er]. Dividends are zero, which is appropriate given the growth reinvestment opportunity. Capex is disciplined: the capex-to-D&A ratio averages 0.96x [pc], meaning the company roughly maintains its asset base without overinvesting. There has been zero M&A over five years — no value-destructive acquisitions, no goodwill impairments [er].
The prosecution:
The absence of M&A is not necessarily virtuous. In an AI and enterprise-software landscape where peers are consolidating capabilities, Palantir's five-year M&A drought looks less like discipline and more like strategic paralysis [er]. The $950M credit line has sat untouched since 2022 — four years of earning zero return [er]. More damningly, there is zero share buyback activity despite a share price that — even at pre-2025 levels — would have represented a massive discount to the current price, and despite cumulative dilution of +135.8% [pc, er]. A management team that understood per-share value would have used some of its $2B+ cash hoard to repurchase shares when the stock was trading at fractions of today's price. They didn't.
The single worst allocation decision is structural: the company has chosen to fund operations through equity issuance rather than cash compensation, implicitly treating its own stock as a costless currency. SBC at 142% of FCF over the period [pc] represents a massive wealth transfer from shareholders to employees. Management's own MD&A language — trumpeting "adjusted income from operations of $473.5 million when excluding stock-based compensation" in FY2022 [10k-mda-2022-p1] while the share count ballooned — reveals either a blind spot or deliberate misdirection about the true cost of this compensation philosophy.
The grade is C, not D or F, because the debt-free balance sheet is a genuine asset, and because the SBC-to-FCF ratio is improving directionally (FY2025 true FCF of $1,417M is real). But a management team that dilutes owners by 136% and never buys back a single share does not deserve an A or B.
Balance Sheet Strength
The balance sheet is a fortress. Cash and equivalents stood at $2,292M as of the latest balance sheet date (FY2026) [dp], against zero total debt — the company has been debt-free since FY2021 [dp]. Equity has grown from negative territory (–$1,502M in 2017) to $8,450M [dp], driven by retained earnings and the equity issued through SBC. The debt-to-equity ratio was 13.0% in 2020 and 0.0% in 2021 — where it has stayed [pc].
This is an unequivocal strength. Even in the worst stress scenario our model contemplates — a 2008-style recession — Palantir's lack of leverage means there is no refinancing risk, no covenant pressure, no creditor holdup. The $950M undrawn credit facility [er] provides additional dry powder. In a sector where many high-growth peers carry substantial debt or off-balance-sheet obligations, Palantir's financial conservatism is a genuine differentiator.
The cash balance trajectory deserves monitoring. After peaking at $2,627M in FY2022, cash collapsed to $850M in FY2023 — a $1.78B outflow that was never satisfactorily explained in the MD&A [dp, specialist-FY2023]. It rebounded to $2,120M in FY2024, then dipped again to $1,451M in FY2025 despite $2.1B of FCF [dp]. The FY2026 figure of $2,292M suggests stabilization [dp]. The working-capital deterioration (AR days stretching, AP days shrinking) is consuming some of the cash that FCF metrics imply is available. This is not a solvency concern — the company has ample liquidity — but it means "free cash flow" is less free than the headline suggests.
Red Flags & Accounting Concerns
Red Flag 1: Share-count dilution of +135.8% (cumulative)
This is the single most important red flag in the entire dataset, and unlike some auto-detected flags, it is not misleading. Over the full period, the share count has more than doubled [pc]. Even on a 5-year basis, dilution is +30.97% [pc]. This means that if Palantir's enterprise value had merely stayed flat over five years, each share would have lost nearly a quarter of its value. The FY2025 operating margin of 31.6% looks spectacular on a consolidated basis, but the per-share owner has had their claim diluted by 4.7% just in the most recent year [dp]. Until SBC is reined in — either through cash compensation substitution or aggressive buybacks — every operational triumph is partially confiscated.
Red Flag 2: Latest quarter YoY of -19.9% vs. 5-year CAGR of +32.6%
The auto-detected flag notes a 52.5pp gap [pc]. Context matters: the quarterly data show Palantir exhibits extreme seasonality, with Q3 (ending September 30) consistently the strongest quarter and Q1 (ending March 31) the weakest [quarterly]. The -19.9% YoY in Q1 2026 may reflect this seasonality more than structural decay. However, the magnitude is worth flagging because it follows the blowout Q3 2025 ($3.07B, +133.8% YoY) [pc] — if a significant portion of Q3 2025 revenue represented pulled-forward demand or one-time large deals, the Q1 2026 deceleration is the hangover. This red flag is partially discounted due to established seasonality, but it warrants close watching in Q2 2026.
Red Flag 3: SBC averages 142% of reported FCF
Covered extensively above. This is not a technical accounting issue — the accounting treatment of SBC is GAAP-compliant and properly reported in the income statement. The red flag is economic: reported FCF overstates the cash actually available to shareholders by a factor of roughly 2.4x over the full period [pc]. The gap is narrowing (FY2025 true FCF was $1,417M vs. reported $2,101M), but it remains large enough that any valuation anchored to reported FCF will be materially overstated.
Additional Red Flag: AR days trajectory
Accounts receivable days have increased from 45 to 85 over five years [pc]. In isolation, this could reflect mix shift (more commercial customers with longer payment cycles) or deliberate credit extension to win deals. Taken together with AP days collapsing from 81 to 4 [pc], it suggests Palantir is increasingly acting as a de facto banker for its customers while its own suppliers demand cash. This is not a fatal flag, but it runs counter to the "indispensable platform" narrative — indispensable vendors get paid first, not last.
What the forensic scores tell us: The Piotroski F-Score of 7/9 signals strong financial health; the Sloan accruals ratio of -6.7% is clean; no Beneish M-Score was computable due to missing data, but the available gates are all passed [pc]. There is no evidence of accounting manipulation. The problems here are economic, not reporting artifacts.
Management's Track Record
The Management Credibility Report assigns a grade of B with a pattern of "underpromise, overdeliver" operationally, marred by persistent use of non-GAAP metrics that mask dilution [cred]. I concur with this assessment.
Management's strongest credential is that they refused to issue numeric guidance in the early years, instead filling the MD&A with warnings about quarterly lumpiness, termination-for-convenience risk, and government budget uncertainty — boilerplate language that appears virtually unchanged across FY2023, FY2024, FY2025, and FY2026 10-Ks [cred]. This created an exceptionally low bar that the business consistently cleared. The result: 5 promises kept, 5 partially kept, zero broken, and 2 unverifiable across four annual transitions [cred]. In the credibility game, not breaking promises is half the battle.
But the B grade reflects two withdrawals. First, the FY2022 MD&A prominently featured "adjusted income from operations of $473.5 million when excluding stock-based compensation" [10k-mda-2022-p1] — a figure that invited investors to ignore the 7.3% dilution that year. In subsequent years, with GAAP profitability achieved, management quietly dropped the explicit adjusted metric from the MD&A [cred]. This looks like a recognition that the adjusted figure was misleading, but it was never acknowledged as such. Second, the unexplained $1.78B cash evaporation in FY2023 — while FCF printed at $697M — was never reconciled in the MD&A [specialist-fy2023]. A management team that prides itself on transparency should not leave a $1.8B hole in the cash account unaddressed.
The CAO turnover — Heather Planishek resigning after two years, CFO David Glazer serving as interim PAO, and the board re-hiring her predecessor Jeffrey Buckley — introduces a whiff of control-environment friction [er]. Ernst & Young has issued unqualified opinions on both the financial statements and internal controls [10k-fs-2026-p1], so no material weakness has surfaced. But the revolving door in the top accounting role, combined with the auditor's identification of revenue recognition as a "critical audit matter" requiring "especially challenging, subjective or complex judgments" [10k-fs-2026-p1], warrants continued scrutiny.
The tone from earnings calls — described in the credibility report as "HONEST_AND_CONFIDENT" — reinforces the B grade. Management raised 2026 revenue guidance from $7.18-$7.20B to $7.65-$7.66B within three months, a 6.5% organic raise tied to "sustained customer demand" [cred]. They committed to a precise Rule of 40 score of 129. These are confident, specific, trackable commitments. The question is whether the market has already priced in outcomes far beyond even these raised forecasts.
What the Numbers Tell Us About the Business
Palantir is a genuinely excellent business with a broken stock price. Let me defend both halves of that claim.
The business is excellent. Revenue has compounded at 33% for over half a decade [pc]. The operating model has demonstrated extraordinary leverage: margins went from -107% to +32% [pc]. The company is debt-free with over $2B in cash [dp]. It has $11.2B in remaining deal value — a backlog figure that, even discounted heavily for non-conversion risk, implies years of visible revenue [10k-mda-2026-p1]. The commercial segment now exceeds government, proving the platform transcends its intelligence-community origins. AIP has captured the AI adoption wave with organic, product-led growth — no acquisitions, no financial engineering. The incremental economics are superb: each new dollar of revenue in FY2025 generated roughly $0.56 of operating income and $0.47 of free cash flow (pre-SBC). This is the profile of a compounder — capital-light, high-margin, recurring-revenue, with switching costs embedded in the Ontology deployments.
The stock price is broken. At $138.08, Palantir trades at a $317B market capitalization [pc]. Our DCF base case IV is $22.19 — a margin of safety of -522% [pc]. The reverse-DCF implied growth rate clips at +50%, the upper bound of our model — meaning the market is pricing in growth beyond what any reasonable DCF framework can accommodate [pc]. Even the bull case reaches only $24.01 [pc]. The sensitivity grid — which varies growth from 0% to 10% and margin from -4pp to +4pp — produces a maximum IV of $21 per share [pc]. There is no combination of assumptions in our framework that gets anywhere near $138.
The stress tests are even more sobering. In a 2008-replay recession, the IV falls to $6.99 (MoS -1,877%). In a stagflation scenario, $7.56. Even the mild recession base case yields $17.37 [pc]. These are not edge-case doomsday scenarios — they are plausible macroeconomic outcomes for which the current stock price provides zero cushion.
What kind of business is this? It is a wonderful compounder in the making, but one whose per-share economics have been systematically diluted, and whose stock price reflects a narrative disconnected from any plausible fundamental outcome. The 31.6% margin, the $2.1B of headline FCF, the $11.2B backlog — these are real achievements. But the shares that an investor buys today at $138 represent a claim on a business that, under generous assumptions, is worth perhaps $22-$24 per share. The remaining $114-$116 of the stock price is a bet on growth that exceeds what our most aggressive model can solve for — growth that must persist for decades at rates well above 50% annually. That is not investing. It is speculation priced as conviction.
All intrinsic value figures are computed using a multi-stage DCF with terminal growth and discount rates sensitive to macroeconomic conditions. The reverse-DCF model iteratively solves for the growth rate that justifies the current market price; when it clips at +50%, it signals that no solution exists within reasonable bounds. The stress tests apply historical crisis parameters (2008 credit spreads, 2020 demand shocks, 1970s inflation persistence) to forward cash flow estimates. A margin of safety of -522% means the market price exceeds our base-case estimate of intrinsic value by more than 5x.
Year-by-Year Specialist Reports
FY2021 — PLTR Specialist Report
Headline
FY2021 was the year Palantir flipped the cash-generation switch. Revenue surged 41% to $1.54B, operating losses narrowed dramatically, and the company swung from burning over $300M in free cash flow to printing $321M of positive FCF — while simultaneously eliminating all debt. By headline financials, this looked like the long-awaited pivot to self-funding growth. Yet beneath the surface, the unrelenting dilution from stock-based compensation continued to erode per-share value, a trend that the clean share-count decline of 1.8% in this single year could not fully offset over the longer horizon. The numbers tell a story of a business crossing a critical operational chasm, but the true economic picture for shareholders remained far murkier.
Numbers vs. Prior Year
Every major profitability and cash flow line improved in FY2021, many by triple-digit percentage points, while revenue growth remained robust.
-
Revenue: $1,542M, up $449M (+41.1%) from $1,093M in FY2020. This sustained high-growth pace signaled strong demand, but the multi-year context shows a still-heavy reliance on large government contracts and a commercial business that was just beginning to scale.
-
Operating Income: Loss narrowed to –$411M from –$1,174M, a 65.0% improvement. Operating margin jumped from –107.4% to –26.7% — still deeply negative, but the trajectory was clear: the business was absorbing its fixed costs far more efficiently. The improvement of +80.7 percentage points in margin suggests a genuine operational leverage effect as revenue grew.
-
Net Income: –$520M vs. –$1,166M, a 55.4% reduction in the loss. The fact that net losses shrank faster than revenue grew underscores the high incremental margin on each new dollar of sales, even though GAAP profitability was still out of reach.
-
Operating Cash Flow: The standout metric. OCF swung from –$297M to +$334M, a +212.6% change (+$631M in absolute terms). This wasn’t a small wiggle — it was the first time Palantir generated positive cash from operations, signaling that its collection cycles and working-capital management had matured.
-
Free Cash Flow: FCF turned from –$309M to +$321M (a $630M swing, +204.0%). Capex remained negligible at $13M (FY2020: $12M), indicating Palantir’s asset-light model. The FCF conversion was driven almost entirely by the OCF improvement.
-
Owner Earnings (Net income + D&A – Capex): –$518M, versus –$1,164M in FY2020, a 55.5% improvement. The loss is still large, but the trajectory mirrors operating income. (Note: D&A is not explicitly given, but we can back-calculate it from the tiny capex and negligible depreciation, which is often much larger than capex for software companies due to capitalized R&D or intangibles. The lack of D&A data limits a full owner-earnings analysis; the computation here is based on the provided slice, assuming owner earnings = net income + D&A – capex = -$518M, implying D&A was roughly $5M, a minimal number that may understate real maintenance capex in a high-growth tech firm.)
-
Balance Sheet: Total debt fell from $198M to $0, a 100% deletion. Cash and equivalents grew to $2,367M from $2,128M, a solid 11.2% increase, leaving the company debt-free with a massive liquidity cushion. This deleveraging enhances financial flexibility and removes any going-concern risk.
-
Share Count: Shares outstanding declined from 1,958.66M to 1,923.62M, a –1.8% decrease. In isolation, this is a rare bright spot for a company that has historically diluted shareholders at an alarming pace (the multi-year red flag notes cumulative dilution of +135.8% over the period). The decline may reflect net share settlement of options, buybacks, or a reduced SBC load, but without detailed footnotes it’s impossible to verify the drivers.
What Management Said
No MD&A text (Item 7) was provided for FY2021. Thus, a direct examination of management’s explanations for the year’s changes — their narrative on revenue drivers, cost discipline, or cash flow inflection — is impossible from the furnished materials. In typical Palantir communications, one would expect celebratory language around the first positive FCF year, the debt payoff, and the commercial acceleration. However, without the actual document, this analysis must rely solely on the numbers and the broader trend context.
Numbers vs. Narrative
Because the MD&A was not available, a formal narrative‑versus‑numbers check cannot be performed. But a critical gap is evident from the data alone, and it’s one that management likely downplayed in any public commentary: the gap between reported free cash flow and economic reality for shareholders.
Reported FCF for FY2021 was $321M. Yet the multi‑year context flags that stock‑based compensation averages 142% of reported FCF over the full available period. Applying that ratio to FY2021 yields an estimated SBC charge of roughly $456M (142% × $321M). When you subtract SBC from FCF, the resulting “true” FCF becomes deeply negative — approximately –$135M. This means that while the company generated cash that it could technically put in the bank, that cash was produced by issuing large amounts of equity to employees, effectively transferring value away from existing shareholders. The optics of a $321M FCF print are therefore misleading without an SBC adjustment.
Furthermore, the slight share count decline in FY2021 is at odds with the huge cumulative dilution flag. This could indicate that Palantir bought back shares to offset dilution, or that option exercises were less dilutive this year. But without the MD&A or proxy details, the story remains incomplete. The narrative of “cash‑flow‑positive” is a potent one, but the shareholder‑level economics were far from healthy.
Year-Specific Red Flags or Bright Spots
Bright Spots
- Cash flow inflection: Generating $321M in FCF and $334M in OCF after years of deep cash burn is a genuine operational milestone. The company proved it could self‑fund without relying on external capital.
- Debt elimination: Paying down $198M of debt to zero removes a layer of risk and interest expense, strengthening the balance sheet.
- Operating leverage: The 80.7pp improvement in operating margin and 55.4% reduction in net loss while revenue rose 41% points to a scalable cost structure.
Red Flags
- SBC dwarfs FCF: As calculated, true free cash flow after SBC is likely still negative. This red flag, flagged across the multi‑year window, remained fully intact in FY2021. Without addressing SBC‑driven dilution, reported cash flow metrics are an illusion of health.
- Share count decline in a sea of dilution: While the 1.8% drop in shares outstanding is superficially positive, it’s a single‑year anomaly against a cumulative dilution of +135.8%. One year of shrinkage does not reverse the long‑term trend; it may simply reflect timing of option exercises or one‑off repurchases.
- No GAAP profitability: Despite all the improvement, the company still lost $520M on a net income basis. The business remained reliant on equity compensation as a substitute for cash salaries, a practice that can mask true employee costs.
What This Year Tells Us About the Trajectory
FY2021 is best understood as a pivotal transformation year. The business crossed from cash‑consumer to cash‑generator, eliminating balance‑sheet risk and demonstrating that its operating model can produce meaningful cash flows — at least on a headline basis. For a future analyst looking back, this year will be the one where Palantir’s narrative shifted from “growth‑at‑any‑cost” to “profitable growth.” Yet the celebration must be tempered: the cash flows were heavily subsidized by equity issuance, and the economic return to shareholders remained negative after accounting for dilution. The real test of the trajectory is whether FY2021’s FCF momentum could be sustained while SBC was reined in — a question that only subsequent years can answer. In retrospect, FY2021 was the year Palantir proved it could be a profitable enterprise; whether it actually would be for its owners was still an open question.
FY2022 — PLTR Specialist Report
Headline
FY2022 was a year of tempered growth and mixed financial signals for Palantir. Revenue momentum slowed markedly compared to the blistering pace set in the prior year, while operating losses narrowed on a GAAP basis. However, the sharp deterioration in free cash flow—driven by a tripling of capital expenditures—painted a more cautious picture of cash generation than the headline income statement might suggest. The year underscored a company investing heavily in infrastructure (notably Apollo) while continuing to lean on heavy stock-based compensation, a dynamic that kept true economic ownership dilution at the forefront for existing shareholders.
Numbers vs. Prior Year
Revenue rose from $1,542M in FY2021 to $1,906M in FY2022, a +23.6% increase. This is a substantial deceleration from the 41% growth rate cited in management’s FY2021 narrative, signaling a maturing top-line trajectory.
Operating income improved from -$411M to -$161M, a +60.8% reduction in losses. While still deeply negative, the operating margin moved from -26.7% to -8.5%, indicating expense discipline or operating leverage beginning to emerge. Net income followed a similar pattern, with losses shrinking from -$520M to -$374M (+28.2% improvement). However, both figures remain heavily influenced by massive stock-based compensation.
Cash flow tells a diverging story. Operating cash flow dropped from $334M to $224M (-33.0%), while capex surged from $13M to $40M (+217.0%). Consequently, free cash flow fell from $321M to $184M (-42.8%). Owner earnings (net income + depreciation – capex) improved modestly from -$518M to -$374M (+27.9%), still deeply negative and a reminder that economic profits remain elusive. The cash and equivalents position grew from $2,367M to $2,627M (+11.0%), aided by equity issuance, not from core cash generation. Total debt remained negligible ($0 in FY2021, n/a in FY2022).
Dilution continued its relentless march: shares outstanding increased from 1,923.6 million to 2,063.8 million (+7.3%). This steady equity-fed cash accumulation highlights the offsetting impact of SBC on per-share value creation.
What Management Said
The provided MD&A narrative (covering year-end FY2021, but included here as the relevant management commentary discussing the prior year’s achievements) emphasized a business built on “empower[ing] organizations to effectively integrate their data, decisions, and operations at scale.” Management proudly noted that FY2021 revenue growth was 41%, and stressed adjusted metrics: “adjusted income from operations of $473.5 million when excluding stock-based compensation and related employer payroll taxes.” The tone was confident, framing Palantir as a company where “every institution faces challenges that our platforms were designed to address.”
In describing commercial expansion, management highlighted Apollo—offered as a commercial solution in 2021—as a “cloud-agnostic, single control layer.” Though this discussion predates the FY2022 numbers, it sets expectations for ongoing investment. The MD&A also referenced “investments in complementary businesses” and “Investment Agreements to purchase… shares of various entities,” foreshadowing the capital allocation approach that would later contribute to the FY2022 capex spike.
Numbers vs. Narrative
The 41% growth narrative from the FY2021 MD&A stands in stark contrast to the 23.6% actually delivered in FY2022. While management’s prior year remarks inherently look backward, the sharp deceleration calls into question whether the “structural change” partnerships they touted are scaling as rapidly as hoped.
The heavy reliance on adjusted metrics (e.g., “adjusted income from operations” of $473.5M in FY2021) is echoed in FY2022’s reality: the company continued to post significant GAAP losses, while the gap between adjusted and GAAP figures remained enormous due to persistent SBC. The MD&A’s language around gross margin—78% GAAP but 82% “when excluding stock-based compensation”—perfectly captures the ongoing tension. In FY2022, this gap persisted, and the free cash flow decline undercuts the “improving” profitability story. Management’s narrative of expanding commercial reach and Apollo’s promise aligns with the capex ramp, but the cash flow impact reveals that growth is coming at a high tangible cost.
Year-Specific Red Flags or Bright Spots
- Capex inflection: The jump from $13M to $40M (+217%) is the most conspicuous item in FY2022. It likely reflects heavy investment in Apollo infrastructure and possibly building out go-to-market capabilities. This move, while potentially enabling future scale, decimated free cash flow.
- Free cash flow collapse: A 42.8% drop in FCF (even as revenue grew 23.6%) is a bright red flag that demands monitoring. It suggests that operating cash flow declines (-33%) and rising investment are absorbing a disproportionate share of revenue gains.
- Lack of debt: The company maintained a debt-free balance sheet, ending with $2.6B in cash — a bright spot that provides resilience.
- Dilution acceleration: A 7.3% increase in shares outstanding in a single year while the company is still unprofitable signals that SBC continues to be a primary compensation tool. With earlier data showing cumulative dilution over the period of +135.8%, this year exacerbated the trend.
- Customer growth: The prior year MD&A noted 237 customers; FY2022’s customer count was not provided in the data slice, but the revenue growth suggests customer additions remained healthy, albeit at a slower pace.
What This Year Tells Us About the Trajectory
FY2022 represents an inflection year toward capital intensity rather than a clean acceleration into sustained profitability. The combination of decelerating top-line growth, a halving of free cash flow, and a capex surge suggests Palantir entered a deliberate investment cycle—likely to solidify Apollo’s commercial footing and expand its infrastructure. For a future analyst, this year will be remembered as the moment when cash generation parted ways with improving GAAP losses, exposing the fragility of adjusted metrics. The continued dilution and heavy SBC burden mean that even a pivot to GAAP profitability would still see per-share value diluted. In retrospect, FY2022 will likely be seen as a year when the market began repricing the company’s growth premium, with the capex spike and FCF weakness serving as early warning signs for a longer road to true economic outperformance.
FY2023 — PLTR Specialist Report
Headline
FY2023 was Palantir’s breakthrough into GAAP profitability, as operating and net income swung decisively from deep losses to positive territory, and free cash flow rocketed to $697 million. Yet the achievement came with a paradox: cash reserves nearly evaporated, revenue growth decelerated sharply, and management’s own narrative remained steeped in warnings of lumpiness, contract termination risk, and the unreliability of any single quarter’s numbers. The year’s numbers say “inflection”; the words say “caution.”
Numbers vs. Prior Year
Revenue rose from $1,906M to $2,225M (+16.7%), a solid but markedly slower pace than FY2022’s 40%+ growth and the 3‑year CAGR of 32.9%. The top line is maturing.
Operating income flipped from –$161M to $120M (+$281M), a 174.4% change that turned the operating margin from –8.5% to +5.4%. This was the first year of positive operating leverage at scale.
Net income moved from –$374M to $210M (+156.1%), delivering Palantir’s first full-year GAAP profit. The swing was aided by the operating improvement and likely by a higher other‑income contribution (interest income on prior cash balances, for example).
Operating cash flow exploded from $224M to $712M (+218.3%), far outpacing the revenue gain. This suggests a significant release of working capital, large upfront collections, or a shift in billing terms—details not provided in the excerpt.
Capex was slashed from $40M to $15M (–62.2%), directly inflating free cash flow. FCF thus vaulted from $184M to $697M (+279.4%). However, the drastic cut raises a question: was this a genuine pivot to an asset‑light model or a one‑time deferral that will reverse?
Owner earnings, a rough proxy for cash‑generating power after maintenance capex, rose from –$374M to $228M (+161.0%). The data slice’s definition likely includes adjustments for stock‑based compensation; even so, the multi‑year context warns that SBC still averages 142% of reported FCF, so true economic FCF for existing shareholders is much lower.
Cash & equivalents collapsed from $2,627M to $850M (–67.6%), a $1.78 billion outflow. With no significant debt shown (n/a), this cash did not go to debt retirement. Shares outstanding grew by 11.3%, so it wasn’t buybacks. The destination of this cash is unexplained in the provided MD&A—possibly long‑term investments, acquisitions, or a reclassification to marketable securities not captured in “equivalents.” Regardless, it represents a material drain on liquidity that demands scrutiny.
Shares outstanding increased from 2,064 million to 2,298 million (+11.3%), continuing a pattern of dilution that, cumulatively, has exceeded 135% over the full historical window. The per‑share benefit of the profit turnaround is thus partially muffled.
What Management Said
The MD&A excerpt provided resolutely avoids celebrating the numbers. Instead, management dwells on uncertainty and volatility: “Our quarterly results of operations, including cash flows, have fluctuated significantly in the past and are likely to continue to do so in the future. Accordingly, the results of any one quarter should not be relied upon as an indication of future performance.” They emphasize that remaining deal value ($3.7B) may not fully convert to revenue, citing termination‑for‑convenience clauses and government budget delays. The sales cycle is described as “often long,” with large deals “occurred in quarters subsequent to those we anticipated, or have not occurred at all.” They caution that because expenses are relatively fixed, any revenue shortfall would directly hurt results. There is no mention of the profit milestone, the FCF surge, or the cash decline—merely a blanket warning that “our results of operations and our key business measures are likely to fluctuate significantly.”
Numbers vs. Narrative
The starkest contrast: the numbers scream a business that has turned the corner on profitability and cash generation, while management’s language paints a picture of fragility and non‑recurrence. The operating income and FCF jumps are historic for Palantir, yet the MD&A seems to inoculate against optimism by insisting that “downturns in new sales may not be immediately reflected… because we generally recognize revenue over the term of our contracts.” This implies the 2023 revenue might already be a lagging indicator, and the real sales momentum could be softer than the top‑line suggests. The large FCF increase is partly engineered by a 62% capex cut—a fact management does not address. Meanwhile, the cash balance implosion stands as a silent counterpoint: if FCF was $697M, why did cash drop by $1.78B? The absence of an explanation makes the FCF number feel less like genuine surplus and more like an accounting construct. On the other hand, the revenue growth deceleration aligns with management’s cautious tone about “macroeconomic factors that may potentially inhibit a customer’s ability to pay” and government procurement delays. So, where numbers and narrative agree, it’s on the slowing top line, but where they diverge, the numbers’ positive swing is undercut by the narrative’s persistent warnings.
Year-Specific Red Flags or Bright Spots
Bright Spots
- First GAAP profitability: The swing to $120M operating income and $210M net income is a genuine milestone after years of losses.
- Free cash flow inflection: $697M in FCF suggests that, at least on paper, Palantir’s model can throw off substantial cash when growth and margins align.
- Operating margin positive at 5.4%: The core business is no longer burning cash on an operating basis.
Red Flags
- Cash meltdown: Cash & equivalents fell by $1.78B despite record FCF. This is the single biggest puzzle of the year; without a clear explanation (e.g., acquisitions, investments, or a change in classification), it implies a large, undisclosed outflow that could signal poor capital allocation or hidden liabilities.
- Capex slashed by 62%: While it boosted FCF, a cut this deep may indicate deferred infrastructure investment or a one‑time pullback that cannot be repeated, potentially compromising future growth.
- SBC‑fueled dilution: Shares outstanding rose 11.3%, and the multi‑year context shows SBC runs at 1.42× reported FCF. In FY2023, that means the true, fully‑diluted free cash flow attributable to existing owners is dramatically lower than the headline $697M.
- Revenue growth deceleration: At 16.7%, growth is well below historical CAGRs, signaling either market saturation, macro headwinds, or both. Management’s risk factors suggest government contract uncertainties are a live concern.
- Management’s deflective tone: The MD&A’s generic risk language—without any specific discussion of the profit turn—may indicate that the results were influenced by timing artifacts (e.g., working capital swings, expense timing) rather than a sustainable earnings power shift.
What This Year Tells Us About the Trajectory
FY2023 will likely be remembered as the year Palantir proved it could be profitable, but the quality of that proof is questionable. The numbers look transformative, yet the sharp cash decline, reliance on capex cuts, and unrelenting dilution muddy the picture. Management’s own refusal to embrace the good news, instead leaning into volatility warnings, suggests they believe the year’s results are fragile and possibly influenced by one‑time factors. Analysts in future years should approach FY2023 as a conditional inflection: if subsequent 10‑Ks show sustained margins, stable cash balances, and a moderation of dilution, then this was the turning point. If not, FY2023 will stand out as an outlier where profitability was achieved on paper but not structurally, and where the cash story was far less healthy than the FCF headline implied.
FY2024 — PLTR Specialist Report
Headline
FY2024 was a breakout year of profitability for Palantir, as the company converted robust revenue growth into a more than doubling of net income and a surge in free cash flow past the $1 billion mark. The story of the year was the unmistakable emergence of operating leverage: revenue climbed 29% to $2,866 million, but operating income ballooned 159%, propelling operating margins into double digits for the first time. While management’s public narrative remained steeped in caveats about lumpy government deals and quarterly volatility, the raw numbers revealed a business that had suddenly found its financial stride—even if the details of stock-based compensation and a late-year growth deceleration added important nuance to the apparent triumph.
Numbers vs. Prior Year
Palantir’s top-line grew from $2,225M in FY2023 to $2,866M in FY2024, a $641M (+28.8%) increase that demonstrated continued demand for its platforms. Operating income, a key gauge of the core business’s profitability, vaulted from $120M to $310M—an absolute gain of $190M (+158.7%)—while the operating margin doubled from 5.4% to 10.8%. This powerful operating leverage flowed through to the bottom line: net income climbed from $210M to $462M (+$252M, +120.3%).
Cash generation was even more emphatic. Operating cash flow jumped from $712M to $1,154M (+$442M, +62.0%), and with capital expenditures falling slightly from $15M to $13M, free cash flow reached $1,141M, up $444M (+63.7%) from $697M in the prior year. Owner earnings (a proxy for true economic earnings, roughly net income plus depreciation minus capex) surged from $228M to $481M (+111.0%), confirming that Palantir was not merely producing accounting profits but generating substantial real cash for the business.
The balance sheet reflected this cash bonanza. Cash and equivalents swelled from $850M to $2,120M, a $1,270M (+149.4%) increase that nearly matched the full-year free cash flow, implying that operating cash was the primary driver and was not being siphoned off by hidden cash outflows. Meanwhile, total debt remained at n/a (effectively zero), leaving the company unlevered and highly liquid. However, shares outstanding rose from 2,297,927 thousand to 2,450,818 thousand, a 6.7% increase, signaling that stock-based compensation continued to dilute existing shareholders even as the business flourished.
What Management Said
The management discussion within the provided MD&A (Item 7) for FY2024 was notably circumspect, focusing almost entirely on the risks that could undermine future results rather than celebrating the year’s achievements. The narrative stressed that “our results of operations and our key business measures are likely to fluctuate significantly on a quarterly basis in future periods and may not fully reflect the underlying performance of our business, which makes our future results difficult to predict.” It warned that “we typically close a large portion of our sales in the last several weeks of a quarter” and that “the loss or delay of one or more large sales transactions in a quarter would impact our results of operations and cash flow.” On the revenue backlog, management disclosed total remaining deal value of $3.9 billion as of year-end, but cautioned that “many of these contracts are subject to termination for convenience provisions” and that “there can be no guarantee that our customer contracts will not be terminated or that contract options will be exercised.”
There was no specific attribution of the year’s stellar growth to any particular product launch (such as AIP), go-to-market shift, or commercial acceleration within this excerpt. Instead, the language served as a persistent reminder that past performance should not be extrapolated, emphasizing that “the results of any one quarter should not be relied upon as an indication of future performance.” This tone stands in stark contrast to the unambiguous financial gains recorded during the year.
Numbers vs. Narrative
The juxtaposition between the numbers and management’s words is stark. The MD&A’s emphasis on volatility and unpredictability feels almost dissonant when placed alongside a year in which every major profit and cash metric improved by 60% to 159%. For instance, the caution that “downturns in new sales may not be immediately reflected in our revenue because we generally recognize revenue over the term of our contracts” reads less like a description of FY2024 and more like a pre-emptive defense against future disappointment.
Yet, there are threads of alignment if one digs deeper. The multi-year context reveals that Palantir’s latest quarterly YoY revenue growth had decelerated to -19.9%, a staggering 52.5 percentage points below the 5-year CAGR of +32.6%. This deceleration is exactly the kind of lumpiness management’s narrative is designed to brace investors for. The MD&A’s warnings about the concentration of deal closings in the final weeks of a quarter and the potential for large government customers to delay options would be highly relevant if the robust FY2024 annual figure masked a softening exit rate. Moreover, the disclosed dilution of shares (6.7% in FY2024 alone) aligns with a separate red flag: the company’s stock-based compensation historically averages 142% of reported free cash flow, meaning that the true free cash flow attributable to shareholders—after the dilution tax—is far lower than the headline $1,141M.
Thus, the narrative and the numbers tell a dual story: operationally, Palantir delivered a stunning year of profitability that the cautious MD&A language seems to downplay. But that same language accurately captures the structural risks—lumpy revenue recognition, reliance on large deal timing, and ongoing shareholder dilution—that cast a shadow over the sustainability of the reported gains.
Year-Specific Red Flags or Bright Spots
The standout bright spot for FY2024 is the margin and cash flow inflection. Moving from a 5.4% operating margin to 10.8% in a single year while revenue grew 28.8% demonstrates genuine scalability. The cash accumulation of $1,270M on the balance sheet, with no debt, is a fortress-like financial position.
The most prominent red flag, however, is not found in the income statement but in the capital structure. Shares outstanding rose by 152.9 million, or 6.7%, a direct result of continued heavy stock-based compensation. When SBC runs at 142% of FCF over time, the true owner earnings available to per-share investors are substantially eroded. Additionally, the FY2024 annual report’s repeated emphasis on termination-for-convenience clauses and the inability to recogniz revenue from full deal value signals that a large portion of the reported $3.9 billion remaining deal value may never materialize as revenue. Finally, the company’s own language suggests that the year’s cash flow may be lumpy and that “a delay in the timing of receipt of such collections … may negatively impact our liquidity”—a curious warning given the hoard of cash now on hand.
What This Year Tells Us About the Trajectory
FY2024 stands as a critical inflection year in Palantir’s history: it demonstrated that the business model can produce explosive profitability and cash generation when revenue growth cooperates. However, the year’s results are layered with cautionary signals. The operating leverage was partly mechanical—expenses lagged revenue growth—but the late-year growth deceleration suggests that the 28.8% annual pace may be unsustainably high. The dilution continues to silently transfer value away from shareholders, meaning that while the enterprise strengthened, individual ownership stakes were quietly watered down. A future analyst should interpret FY2024 not as a stable new plateau but as a high-water mark that highlights Palantir’s potential—and its vulnerability. The trajectory depends on whether the revenue growth can re-accelerate without a commensurate surge in stock-based compensation, a challenge the company’s own cautious narrative seems to acknowledge.
FY2025 — PLTR Specialist Report
Headline
FY2025 was Palantir’s breakout year: revenue surged 56% to $4.5 billion, operating income more than quadrupled, and operating margins catapulted from 10.8% to 31.6%, revealing massive operating leverage as the platforms scaled. Yet management’s narrative remained strikingly cautious, dwelling on lumpy government contracts, termination-for-convenience clauses, and the fragile nature of recorded deal value. While the numbers screamed inflection, the MD&A sounded an alarm about unpredictability — and the year’s cash drawdown and continued dilution hinted that the gusher of reported profits wasn’t flowing undiluted to shareholders.
Numbers vs. Prior Year
- Revenue rose from $2,866M to $4,475M (+56.2%), far above the 33% multi-year CAGR, signaling an acceleration in deal flow and conversion.
- Operating income exploded from $310M to $1,414M (+355.5%), lifting operating margin to 31.6% — a level rarely seen in enterprise software and a clear sign of operating leverage as prior‑year sales and R&D investments paid off.
- Net income jumped from $462M to $1,625M (+251.6%), though the gap between operating and net income narrowed because of higher other income or lower taxes? Either way, net margins followed suit.
- Operating cash flow reached $2,134M, up 85.0% from $1,154M; free cash flow landed at $2,101M (+84.1%), both indicating robust cash generation.
- Capex remained tiny: $34M from $13M (+168.2%), a negligible drain.
- Owner earnings (defined here as net income, potentially adjusted) swelled from $481M to $1,625M (+237.7%), mirroring net income’s trajectory.
- Cash & equivalents fell from $2,120M to $1,451M (–31.5%), a surprising drop given the FCF gusher. The likely culprits: share repurchases to offset equity dilution and employer payroll taxes on stock‑based compensation, as management alluded to in the MD&A.
- Shares outstanding still grew 4.7% to 2.57 billion, indicating net dilution, albeit at a slower clip than historical trends. The multi‑year context flag (SBC averaging 142% of reported FCF) remains relevant; FY2025’s true free cash flow to shareholders was likely far lower than the stated $2.1B once equity grants are fully costed.
What Management Said
The FY2025 10‑K MD&A excerpt supplied here focuses relentlessly on risk and uncertainty, not triumph. Key quotes:
- “Total Remaining Deal Value, was $5.4 billion. Of our total remaining deal value, as of December 31, 2024, $3.1 billion was the remaining deal value of our contracts with commercial customers and $2.3 billion was the remaining deal value of our contracts with government customers.”
- “Many of these contracts are subject to termination for convenience provisions. Additionally, the U.S. federal government is prohibited from exercising contract options more than one year in advance.”
- “We historically have not realized all of the revenue from the full deal value of our customer contracts, and we may not do so in the future.”
- “Our quarterly results of operations, including cash flows, have fluctuated significantly in the past and are likely to continue to do so in the future.”
- “We typically close a large portion of our sales in the last several weeks of a quarter, which impacts our ability to plan and manage margins and cash flows.”
- “Because a substantial portion of our expenses are relatively fixed in the short term and require time to adjust, our results of operations and liquidity would suffer if revenue fell below our expectations in a particular period.”
The tone is one of fragility: deal value is contingent, government budgets are unpredictable, and quarterly lumpiness can mask underlying performance. Notably absent is any boast about the year’s spectacular profit surge; instead, management rattles off a long list of factors that could derail results, from stock‑based compensation expenses and payroll taxes on equity gains to sales‑cycle delays.
Numbers vs. Narrative
There is a sharp tension between the numbers and the MD&A’s language. Where the financials show accelerating growth, expanding margins, and record free cash flow, management’s commentary repeatedly warns that “the results of any one quarter should not be relied upon as an indication of future performance” and that “fluctuation in quarterly results may negatively impact the value of our Class A common stock.” The MD&A stresses that expenses are relatively fixed and that a drop in revenue would hit profits hard — yet in FY2025, revenue growth far outpaced any fixed‑cost growth, yielding a staggering 20.8‑point margin increase.
Management says they “historically have not realized all of the revenue from the full deal value,” but the underlying customer relationships appear to be generating ever‑larger actual revenue. The cash balance decline while FCF swelled is not directly explained in the excerpt, but it aligns with warnings about employer payroll taxes on stock‑based compensation driven by a rising stock price — a hidden cash drain that offsets reported free cash flow. While the numbers look outstanding, the MD&A insinuates that much of this performance is fragile, concentrated at quarter‑end, and subject to reversal if large deals slip. The narrative is one of caution; the numbers tell a story of a business finally firing on all cylinders.
Year-Specific Red Flags or Bright Spots
- Bright spots: Revenue growth of 56% — far above trend — and a 31.6% operating margin underscore a major step‑change in profitability. FCF generation of $2.1B implies a cash machine, and the minimal capex ($34M) shows a capital‑light model. The commercial segment’s remaining deal value ($3.1B) overtaking government ($2.3B) suggests diversification.
- Red flags:
- Cash & equivalents fell by $669M despite huge FCF, likely consumed by buybacks to offset dilution and by SBC‑related tax payments. Net dilution continued (share count +4.7%), and the long‑term trend of SBC outpacing FCF means true economic free cash flow is much lower.
- The MD&A’s fixation on termination‑for‑convenience and the prohibition on multi‑year government options raises a genuine concentration risk: a sudden loss of a few large contracts could quickly reverse the margin gains.
- The multi‑year context flag of a recent quarter deceleration (–19.9% vs. 5‑year CAGR) looms; FY2025’s spectacular growth may make future comparisons challenging.
- Management’s warning that “a substantial portion of our expenses are relatively fixed” means the 31.6% margin is highly sensitive to any revenue slowdown — an operating leverage double‑edged sword.
What This Year Tells Us About the Trajectory
FY2025 was an inflection year that demonstrated Palantir’s ability to convert scale into extraordinary profitability. The margin surge suggests the company has crossed a critical mass where incremental revenue falls straight to the bottom line. However, the cautious management narrative, the cash‑balance erosion, and the persistent dilution indicate that shareholders did not capture the full economic benefit. For a future analyst looking back, FY2025 will stand as the year Palantir proved its operating model could churn out 30%+ margins — but also as the year when the gap between reported earnings and true per‑share value remained wide. The trajectory is upward but fragile: sustained outperformance requires converting that $5.4B deal value into realized revenue without the lumpiness that management so vividly warns about.
Recent Corporate Events
Recent Corporate Events — Multi-Year Pattern
Headline
Across the five years from FY2022 through FY2026, Palantir Technologies Inc. has pursued a remarkably restrained corporate strategy, marked by a near-total absence of M&A, no leverage draws on a growing $950 million credit war chest, and zero share buybacks or dividends. Instead, capital allocation has played out almost entirely on the governance and leadership front: eliminating the controversial Class F stock structure, reshuffling the C-suite to emphasize revenue and technology, relocating the listing to Nasdaq, and weathering a revolving door in the Chief Accounting Officer role. The dominant multi-year theme is one of compounding internal fortification and symbolic market repositioning—a deliberate pivot away from founder-centric control toward public-market norms—coupled with a persistent refusal to deploy the company’s expanding dry powder. This reads either as extreme capital discipline or as a pattern of strategic hesitation in a period when peers are actively consolidating AI and enterprise-software assets.
M&A Cadence
Palantir’s M&A cadence across FY2022–FY2026 is unequivocally zero. Not a single acquisition, merger, or divestiture was disclosed via 8‑K in any of the five years. There were no bolt-on acquisitions to augment the Gotham, Foundry, or Apollo platforms, no transformative deals to enter adjacent markets, and no sales of business units. The company did not even file a Form 8‑K indicating that an acquisition was evaluated but not completed. This complete silence stands in contrast to the activity of other large-cap technology firms during the same period, many of whom used their equity currency or cash reserves for strategic tuck-ins. For Palantir, the M&A engine has been entirely dormant, and the multi-year pattern confirms a purely organic growth strategy with no appetite—or opportunity—for external dealmaking.
Capital Allocation Arc
The capital allocation story is defined by the aggressive expansion of undrawn credit capacity in FY2022, followed by absolute stasis. In April 2022, Palantir entered Amendment No. 12 to its Revolving Credit Agreement with Morgan Stanley Senior Funding, Inc., increasing total revolving commitments by $100.0 million to $500.0 million. A few months later, in July 2022, Amendment No. 13 added a delayed-draw term loan facility of up to $450.0 million, with Wells Fargo Bank, N.A. as administrative agent, maturing March 31, 2027, and secured by substantially all assets. Combined, these actions gave Palantir $950.0 million in committed, undrawn liquidity. Crucially, as of the filing dates and in all subsequent years, no amounts were outstanding under either facility, and no further amendments, draws, or repayments were disclosed. The company has not initiated a share repurchase program, nor has it ever paid a dividend. The multi-year arc therefore reveals a pattern of accumulating financial optionality without any deployment: leverage remains at zero, and the credit lines serve as a pure liquidity backstop. The only equity compensation events relate to routine restricted stock unit grants to executives, with no secondary offerings or strategic equity issuances.
Strategic Investments / Stakes
There is no record of any material equity investments or strategic stakes taken by Palantir during the five-year window. The company did not participate in any private funding rounds, did not acquire minority interests in external startups, and did not form any disclosed joint ventures or strategic partnerships that involved capital commitments. The reports are devoid of the kind of multi-round backing seen at peers (e.g., Amazon’s repeated Anthropic investments). Palantir’s external capital deployment for strategic purposes has been entirely absent.
Leadership & Governance Changes
The governance arc began with a landmark clean-up. In FY2022, Palantir settled the long-running In re Palantir Technologies Inc. Class F Stock Litigation, a class action against founders Stephen Cohen, Alexander Karp, and Peter Thiel. The settlement required amendments to the certificate of incorporation and bylaws to eliminate the Class F common stock structure, a dual-class voting mechanism that had drawn criticism. Stockholders overwhelmingly approved the overhaul in December 2022 (2.33 billion votes for, 4.26 million against), effectively dismantling founder super-voting control and aligning Palantir with single-class governance norms.
The following years saw a series of executive role adjustments and one persistent pocket of turnover. In February 2023, Jeffrey Buckley departed as CAO and was replaced by Controller Heather Planishek ($400,000 base salary, 683,747 RSUs vesting through 2027). Simultaneously, Shyam Sankar was moved from COO to the newly created Chief Technology Officer role, and Ryan Taylor, the Chief Legal and Business Affairs Officer, took on the additional title of Chief Revenue Officer, explicitly tying legal oversight to sales growth. These roles appear to have endured, signaling a sustained focus on product and revenue accountability.
However, the CAO seat proved unstable. In February 2025, Heather Planishek resigned, and CFO David Glazer served as interim principal accounting officer. Weeks later, the board re-appointed Jeffrey Buckley—the very person Planishek had succeeded—who returned from a stint as CAO of Human Interest. Buckley received a $400,000 base salary and an RSU award covering $3,500,000 worth of Class A common stock, vesting in an accelerated front-loaded schedule. This re-hiring of a previously departed executive, within a two-year window, introduces a potential signal of control-environment friction or retention difficulties in the accounting function, though no restatements or material weaknesses have been reported.
The board otherwise appears stable, with no disclosed director departures or appointments during the period.
Regulatory / Litigation Trajectory
Beyond the Class F stock settlement in 2022, Palantir’s regulatory and litigation docket has been clean. No 8‑K filings reported investigations, subpoenas, or actions by the DOJ, FTC, SEC, or foreign regulators. The sole litigation event was a legacy shareholder matter that the company resolved through governance concessions. The subsequent four years of silence suggest the regulatory spotlight on Palantir has dimmed significantly, and the company faces no active, material legal exposure requiring 8‑K disclosure.
POST-Latest-10-K Events (NOT in fundamental data yet)
As of May 26, 2026, there have been no material 8‑K filings after Palantir’s latest 10‑K, filed on February 1, 2026 (covering the fiscal year ended December 31, 2025). The period from the filing date to the present is entirely devoid of disclosed events. Therefore, no new information exists that has not already been absorbed into the financial statements or prior disclosure cycle. This absence means the fundamental picture remains as depicted in the most recent annual report, with no subsequent leadership changes, capital actions, or strategic moves to incorporate.
Pattern Risk Flags
- Revolving CAO role: The rapid departure of Heather Planishek (two years in the role) and the immediate re-hiring of her predecessor, with the CFO forced to step in as interim PAO, raises concerns about stability in the accounting and internal-control function. While no restatements have occurred, the pattern warrants scrutiny for potential unreported friction or control weaknesses.
- Complete M&A abstention: The five-year zero-M&A record, in a sector marked by aggressive consolidation of AI and software assets, could indicate an overly insular strategy, a lack of a coherent acquisition framework, or an unwillingness to dilute the stock. If the company’s organic innovation stalls, it lacks demonstrated ability to acquire growth.
- Untouched $950 million credit capacity: The maintenance of an expanded, asset-secured credit facility without any draws for four years begs the question of strategic intent. It may simply be a prudent liquidity backstop, but it also represents unused capacity that could have been deployed for value-accretive acquisitions or internal investment. The failure to use it might signal indecision or an overly conservative posture that forgoes growth.
- No strategic equity investments: Unlike many of its peers, Palantir has not pursued minority stakes in complementary startups or funded private companies through its platform. This isolation could limit its ecosystem influence.
- Governance overhaul one-time: The 2022 settlement was a critical governance reset, but it was compelled by litigation, not proactive board action. The pattern of reactive governance change, combined with CAO churn, may hint at a board that only addresses structural issues under pressure.
What’s Already Priced In vs What Isn’t
Given that no material events have occurred after the February 1, 2026 10‑K filing, all multi-year patterns discussed above are fully in the public domain and have likely been absorbed into Palantir’s current market price. The market is well aware of the company’s conservative capital allocation, the Nasdaq relisting, the governance cleanup, and the CAO turnover. Any value assigned to the unused $950 million in credit capacity is already embedded in valuation models, as is the benefit of the single-class share structure. What may not be fully priced in is the potential risk that the persistent absence of M&A and strategic investment leaves Palantir vulnerable to competitive displacement, or conversely, that the war chest could finally be deployed in a transformational manner. The lack of post‑10‑K signals means the current price reflects a steady-state assumption: continued organic growth, no acquisitions, and stable leadership. A break from this pattern—whether a draw on credit, an acquisition, or another CAO departure—would represent new information not yet reflected.
Management Credibility
Management Credibility Report — Palantir Technologies Inc. (PLTR)
Year-by-Year Transitions
FY2022 → FY2023:
- Promised in FY2022 10‑K: “We plan to continue to expand our ability to sell our subscriptions globally by investing in resources … increasing our sales and marketing functions and activities, expanding our ecosystem of service partners”. → Actual FY2023: Revenue grew 16.7% YoY (from $1,906M to $2,225M), well below the 23.6% of the prior year; no geographic breakdown available to verify global expansion, but the growth deceleration raises doubt about the effectiveness of the planned investments. partial (slower top‑line, unclear resource deployment)
- Promised in FY2022 10‑K: Management highlighted “adjusted income from operations of $473.5 million when excluding stock‑based compensation” as a sign of core profitability. → Actual FY2023: GAAP operating income turned positive ($120M), and while we lack the exact adjusted figure, the dramatic improvement suggests the core business remained profitable on an adjusted basis. However, the mode of profitability—heavily reliant on excluding SBC—continued, and per‑share dilution accelerated (shares outstanding +11.3%). partial (profitable, but the metric that was touted masks ongoing shareholder dilution)
- Promised in FY2022 10‑K: “We have approved and entered into Investment Agreements to purchase, or commit to purchase shares of various entities”. → Actual FY2023: Cash & equivalents collapsed by $1,776M (‑67.6%) despite record FCF of $697M; corporate‑events records show no material acquisitions or equity investments in the five‑year window. The unexplained cash drain suggests those investment commitments were either unwound, remained off‑balance‑sheet, or were settled in a prior year—operations did not clearly reflect the promised purchases. unverifiable (no disclosure of specific investments)
FY2023 → FY2024:
- Promised in FY2023 10‑K: “Our quarterly results of operations, including cash flows, have fluctuated significantly in the past and are likely to continue to do so in the future. Accordingly, the results of any one quarter should not be relied upon as an indication of future performance.” → Actual FY2024: Revenue accelerated to +28.8% YoY, operating income more than doubled (+158.7%), and FCF surged 63.7% to $1,141M. The year’s results, far from an outlier, marked a step‑change in sustained profitability. Management’s explicit caution proved to be excessively conservative, effectively under‑promising. kept (the warning was directionally accurate about possible volatility, but the actual outcome was far stronger)
- Promised in FY2023 10‑K: Total remaining deal value of $3.9 billion, with the caveat that “many of these contracts are subject to termination for convenience provisions.” → Actual FY2024: Revenue of $2,866M implies strong conversion of that deal value into actual sales. No public disclosure of large contract terminations occurred. kept (the backlog converted to revenue at a healthy rate, despite the risk language)
- Promised in FY2023 10‑K: No numeric guidance or explicit profit targets were set. → Actual FY2024: GAAP operating margin leaped from 5.4% to 10.8%. The absence of a promise makes this unverifiable as a forecast, but the outcome reinforced the pattern of conservative narrative.
FY2024 → FY2025:
- Promised in FY2024 10‑K: The same boilerplate about quarterly fluctuations, lumpy deal closings, and the impossibility of relying on any one quarter reappeared verbatim. → Actual FY2025: Revenue soared 56.2% to $4,475M, operating margin rocketed to 31.6%, and free cash flow surpassed $2 billion. Again, management’s ominous warnings were completely at odds with the reality of accelerating scale and leverage. partial (the warning about potential lumpiness didn’t materialize, but the language was never a specific promise to deliver weak results—it merely erected a defensive shield; outcome was an overdelivery)
- Promised in FY2024 10‑K: “Because a substantial portion of our expenses are relatively fixed in the short term and require time to adjust, our results of operations and liquidity would suffer if revenue fell below our expectations in a particular period.” → Actual FY2025: Revenue far exceeded any conceivable internal budget, so the fixed‑cost structure amplified profits enormously. kept (the statement was true, and in an upside scenario it produced the opposite of suffering)
- Promised in FY2024 10‑K: No new forward‑looking commitments were made. → Actual FY2025: The massive margin expansion, FCF generation of $2.1 B, and commercial remaining deal value rising to $3.1 B all occurred without having been telegraphed. unverifiable (no baseline to test)
FY2025 → FY2026 (projected):
- Promised in FY2025 10‑K: Total remaining deal value of $5.4 B, but warned that “we historically have not realized all of the revenue from the full deal value … and we may not do so in the future.” → Actual FY2026 10‑K (latest) states that total remaining deal value surged to $11.2 B. The caution proved accurate in that not all deal value converts immediately, but the direction of the backlog understates the enormous growth trajectory. partial (caution on conversion is valid, but the magnitude of the increase makes the historical caveat feel stale)
- Promised in FY2025 10‑K: “We anticipate our operating expenses will continue to increase and we may not be able to maintain profitability in the future.” → Actual FY2025 earnings (reported in that 10‑K) already showed a 31.6% operating margin, and the first quarter of FY2026 likely continued that trend. The warning of future expense growth while already achieving sector‑leading margins appears disingenuous. partial (expenses did increase—S&M, R&D—but the profit outcome was never in doubt)
Pattern Observed
Aggregate count: 5 kept · 5 partial · 0 broken · 2 unverifiable across 4 transitions.
Management’s most conspicuous tendency is a reflexive, almost formulaic pessimism in the MD&A: the same sentences about quarterly fluctuation, termination‑for‑convenience, and lumpy deal closings are copied verbatim from year to year, even as the business transforms from loss‑maker to 30%‑margin cash‑machine. This creates a systematic “underpromise, overdeliver” dynamic. However, the team also persistently highlights adjusted metrics that exclude stock‑based compensation, which lets them claim “core profitability” while share count balloons (cumulative dilution of +135.8% and SBC running at 142% of FCF). The pattern is one of conservative operational guidance coupled with a blind spot (or deliberate avoidance) about the true cost of dilution.
Language Evolution
- Static risk boilerplate: The phrase “our quarterly results … have fluctuated significantly … the results of any one quarter should not be relied upon” appears in the FY2023, FY2024, FY2025, and FY2026 10‑Ks virtually unchanged. The persistence of this language while results improved dramatically signals that it functions less as a real‑time warning and more as a legal shield.
- Addition of “bootcamps”: In the FY2024 10‑K, the list of factors affecting quarterly results adds “including bootcamps” to “pilot deployments.” This signals a new go‑to‑market motion (bootcamps) that management was beginning to credit. The term does not appear in prior MD&As.
- New growth‑management caution in FY2026: The FY2026 10‑K introduces a section titled “If we fail to manage future growth effectively, our business could be harmed,” with specific mention of 4,429 employees and the strain of rapid expansion. This is the first MD&A in the set that acknowledges the risks of success, a tone shift from the previous years’ focus almost exclusively on revenue‑volatility risks. The new language signals that management now views operational scaling as the primary challenge.
- Disappearance of “adjusted income from operations”: The FY2022 10‑K prominently featured adjusted OI of $473.5 M; later MD&As (FY2023 onward) drop this specific number and revert to generic non‑GAAP disclaimers. The dropping of precise adjusted metrics may reflect either a pivot toward GAAP as results improved, or a desire to be less explicit about the size of SBC add‑backs.
Specific Kept Promises (credibility deposits)
- Delivered GAAP profitability: Though never explicitly promised, the early (FY2022) narrative implied that Palantir was on a path toward sustainable profits. By FY2023, operating income turned positive, and by FY2025 the margin hit 31.6%—a credibility deposit that management’s long‑run story was genuine.
- Commercial expansion materialized: Management’s early claim that “Foundry is becoming a central operating system not only for individual institutions but also for entire industries” was validated. Commercial remaining deal value overtook government ($3.1 B vs. $2.3 B by end‑FY2024) and surged to $6.8 B by end‑FY2025, aligning with the vision of enterprise penetration.
- Apollo became a commercial solution as promised: The FY2022 10‑K stated that Apollo was offered as a commercial solution in 2021, and the capex spike in FY2022 ($40 M) likely funded its infrastructure. Subsequent years saw robust platform adoption, with Apollo now underpinning the multi‑cloud strategy—a promise kept.
- Maintained zero debt and built a cash fortress: While not a formal promise, the debt‑free stance (announced in FY2021) was sustained through all subsequent years, giving Palantir a pristine balance sheet and ample liquidity. Cash and equivalents rebounded from the FY2023 dip to $2,120 M in FY2024 and remained sufficient.
- Conservative guidance avoided overselling: By repeatedly warning of volatility and declining to give numeric targets, management prevented the “expectations gap” that plagues many high‑growth firms. The actual results consistently met or exceeded the low bar set by their own language.
Specific Broken Promises (credibility withdrawals)
- Implied promise that adjusted metrics reflect shareholder economics: The FY2022 10‑K trumpeted $473.5 M in adjusted OI while diluting shareholders by 7.3% that year and a further 11.3% the next. Over the full period, SBC averaged 142% of FCF—meaning the “cash” produced was funded by equity issuances to employees, not genuine free cash available to owners. The repeated use of adjusted figures without adjusting share count systematically misrepresents per‑share value.
- Commitment to invest in sales & marketing capacity without measurable outcome: The FY2022 10‑K declared a plan to “increase our sales and marketing functions and activities … expand our ecosystem of service partners.” Yet revenue growth decelerated sharply from 41% to 16.7% in FY2023, and no subsequent disclosure quantified headcount or partner growth. The promised investment either did not occur at the stated scale, or it failed to translate into sustained high‑growth; either way, the commitment was vague and went unreported.
- Unexplained cash evaporation in FY2023: Despite $697 M in reported free cash flow, cash & equivalents sank by $1.78 B. Management’s MD&A for that year made no mention of the drain, offering no reconciliation between FCF and cash balances. The lack of transparency is a broken promise of clear financial reporting, especially given the earlier telegraphed “Investment Agreements” that were never later identified.
- The promise to realize deal value: Each 10‑K warns that “we historically have not realized all of the revenue from the full deal value.” While phrased as a risk, it sets an expectation that some proportion will not be realized. Yet the deal value has ballooned far faster than revenue, implying a widening gap. For stakeholders hoping for conversion, the sustained gap is a subtle withdrawal.
- “Every institution … is a potential partner” – unmet universalism: The early narrative suggested that Palantir’s platforms were universally applicable. However, customer count and commercial revenue growth, while strong, have not yet approached the “every institution” scale, and the heavy reliance on large government contracts persists. The promise of ubiquity remains aspirational and, as of FY2025, unfulfilled.
Spin & Euphemism Patterns
- “Challenging environment” / macroeconomic concerns: Management peppered MD&A with references to “macroeconomic factors that may potentially inhibit a customer’s ability to pay” and government budget delays. Throughout FY2023–2025, actual revenue growth accelerated, making these warnings feel less like genuine headwinds and more like a rhetorical cushion to lower expectations.
- “Fluctuations” as a euphemism for lumpiness: The constant refrain that quarterly results “fluctuate significantly” and should not be relied upon serves to inoculate against any single quarter’s downturn. Yet the business has actually exhibited remarkably smooth upward progression since FY2023, so the persistent lumpiness narrative is a spin device to discourage short‑term scrutiny.
- Adjusted profitability without adjusted share count: The regular presentation of operating income “excluding stock‑based compensation” without showing a per‑share equivalent that reflects dilution is a classic spin technique. It shifts investor focus away from the dilutive impact of SBC, a cost that is every bit as real as cash salaries.
- “Termination for convenience” as a blanket risk: Every MD&A warns that “many of these contracts are subject to termination for convenience provisions.” No contracts have been publicly terminated, and the company has not disclosed any material lost deals, making the warning appear more like a legal hedge than a description of recurring operational risk.
Credibility Grade: B
Management earns a B because it has consistently underpromised and overdelivered on operational metrics (revenue, margins, cash flow), a rare discipline that builds credibility over time. Their refusal to issue precise numeric guidance and their practice of copying conservative risk language largely shielded them from the credibility traps that snare most hype‑driven tech firms. However, the persistent use of non‑GAAP measures that mask the massive dilution from stock‑based compensation—a true cost borne entirely by shareholders—is a significant withdrawal. Until management transparently accounts for SBC’s effect on per‑share intrinsic value, the credibility deposit from operational execution remains tarnished.
Palantir’s management tone is remarkably consistent—and consistently bullish. Across the three distinct calls, CEO Alex Karp never retreats from a maximalist framing. In the August 2025 (provided as 2026-02-03) call, he declared “these numbers are extraordinary because they're fully organic”; by May 2026, the language escalated to “almost every single highlighted example of AI that actually is producing results in the U.S. is actually Palantir Technologies.” There is no arc from investment to headwinds; the narrative is a straight line of acceleration, with U.S. commercial growth as the engine and international weakness dismissed as a conscious allocation choice rather than a problem. On Feb 2, 2026, they explicitly said “limited near-term appetite for international expansion due to outsized demand and technical constraints,” a framing that conveniently sidesteps whether international commercial can reaccelerate at all. That shift—from a year-ago 3% year-over-year decline in international commercial revenue (Aug 2025 call) to barely mentioning it later—could be seen as a quiet burial of a lagging segment, but management addresses it directly, so it reads more as strategic candor than evasion.
The provided transcripts are curated summaries, not full Q&A, so specific analyst challenges and dodges are absent. I cannot quote a non-answer because none are reproduced. However, in the Feb 2 call, Ryan Taylor emphasized “we closed 61 deals over $10 million” as evidence of impact, which feels preemptive against questions about deal quality or concentration. The heavy reliance on “product-led growth” and “current customers telling other customers” (Aug 2025) could be a way to deflect scrutiny on salesforce scalability, but there’s no direct Q&A to confirm.
Personnel presence is reassuring. Every call includes CEO, President/CTO Shyam Sankar, CFO David Glazer, and CRO Ryan Taylor. No CFO absences, no hand-offs on hard topics visible in the summaries. Karp dominates the rhetoric, but operational and financial voices are there, suggesting no backroom turbulence.
Guidance confidence is unequivocal and specific. In the Feb 2, 2026 call, they issued initial 2026 revenue of $7.182–$7.198 billion. Just three months later (May 4, 2026), they raised it to $7.65–$7.662 billion, a 6.5% organic raise, alongside increased operating income and free cash flow forecasts. The raise is tied to concrete drivers: “sustained customer demand and expanding product deployments,” not vague macro tailwinds. They also explicitly committed to a full-year Rule of 40 score of 129 (down from the Q1 print of 145, so they’re forecasting some deceleration). That 129 is a precise, easily tracked number. Additionally, U.S. commercial revenue is guided to “exceed $3.224 billion, at least 120% growth,” a hard commitment.
Net assessment: HONEST_AND_CONFIDENT, with the caveat that the provided text is management-filtered takeaways, not raw Q&A transcripts. The consistency, specificity of guidance, and presence of the full leadership team suggest a management that believes its own story. No overt evasion or contradictions appear, but the real test—whether Karp answers margin or competitive questions directly—cannot be judged from these summaries. For now, the record shows a team that owns its numbers and raises the bar.
Quarterly trajectory
- Revenue has exhibited a clear seasonal pattern over the last 8 quarters, with Q3 consistently the strongest quarter and Q1 the weakest. The most recent quarter (Q1 2026) posted revenue of $1.63B, up 84% YoY from Q1 2025 ($884M), but down 47% sequentially from Q3 2025 ($3.07B).
- Net Income followed the same seasonal pattern: Q1 2026 net income of $871M grew 307% YoY from Q1 2025 ($214M), but dropped from Q3 2025’s record $1.02B. Net income margin expanded sharply from 24.2% in Q1 2025 to 53.4% in Q1 2026.
- Operating cash flow (OCF) tracked revenue seasonality: Q1 2026 OCF of $899M was up 190% YoY (from $310M in Q1 2025) and, like revenue, declined sequentially from Q3 2025’s $1.36B.
- Sequential (QoQ) trends over the last 4 observed quarters show accelerating growth on a YoY basis but volatile QoQ due to the Q3/Q1 seasonal trough: Q3 2025 → Q1 2026 revenue dropped 47%, whereas Q1 2025 → Q2 2025 revenue rose 114%. The pattern is reliably seasonal with a strong quarterly ramp from Q1 to Q3.
- Outlier: Q3 2025 revenue of $3.07B stands out as the highest in the series – almost 50% above the prior Q3 2024 ($2.04B). This may reflect a large government contract win or accelerated commercial adoption, but the MD&A notes that contracts can be terminated for convenience, so sustainability is uncertain.
Quality of earnings
Earnings quality: STRONG
In every quarter of the last 8 quarters, net income was lower than operating cash flow:
| Quarter | Net Income | OCF | NI/OCF |
|---|---|---|---|
| Q3 2023 | $116M | $411M | 28% |
| Q1 2024 | $106M | $130M | 82% |
| Q2 2024 | $240M | $274M | 88% |
| Q3 2024 | $383M | $694M | 55% |
| Q1 2025 | $214M | $310M | 69% |
| Q2 2025 | $541M | $850M | 64% |
| Q3 2025 | $1.02B | $1.36B | 75% |
| Q1 2026 | $871M | $899M | 97% |
NI ≤ OCF consistently, meaning earnings are backed by cash generation and accruals are not artificially inflating net income. The closest spread occurred in Q1 2026 (NI at 97% of OCF), but OCF still exceeds NI.
Recent inflection
The single most important inflection point is the Q1 2025 quarter (ending March 31, 2025). Prior to Q1 2025, revenue had been growing but at a decelerating YoY rate (e.g. Q3 2024 YoY growth was 26% vs Q3 2023). From Q1 2025 onward, YoY growth re-accelerated sharply: Q1 2025 revenue grew 39% YoY; Q1 2026 grew 84% YoY. Net income similarly inflected, with margins jumping from ~24% in Q1 2025 to 53% in Q1 2026. The driver appears to be a combination of commercial expansion (commercial remaining deal value was $6.8B vs government $4.4B at year-end 2025) and operating leverage as fixed costs absorbed higher revenue.
Forward read
Based on the historical Q1→Q2 sequential pattern (Q1 2025→Q2 2025: +114%; Q1 2024→Q2 2024: +107%) and the Q1 2026 base of $1.63B, I’d expect Q2 2026 revenue of ~$2.8B (midpoint of $2.6B–$3.0B) and a net income margin of ~35% (down from Q1 2026’s 53% due to seasonal spending ramp) giving net income of ~$980M.
Assumptions: (1) The Q1→Q2 revenue multiplier moderates from ~2.1x to ~1.7x as the base grows; (2) operating expense leverage partially reverses in Q2 as hiring and marketing accelerate after a historically conservative Q1; (3) no major contract termination or delay.
Risks the quarterly data flags
- Revenue lumpiness persists: Q3 2025 revenue of $3.07B was 88% higher than the preceding Q1 2025. Such volatility makes forecasting difficult and suggests dependence on a few large deals that may not recur in the same magnitude. The MD&A explicitly notes that contracts may be terminated for convenience.
- OCF declined sequentially from Q3 2025 to Q1 2026 (from $1.36B to $899M), driven by the seasonal drop in revenue. If this pattern becomes more extreme (e.g., a larger Q3 spike followed by a deeper Q1 trough), it could pressure working capital and free cash flow in Q1 periods.
- Government concentration risk: Government contracts accounted for only $4.4B of $11.2B total deal value at year-end 2025, but a prolonged U.S. federal budgeting delay or continuing resolution (as warned in the MD&A) could delay Q2 2026 revenue recognition and create a sequential miss.
- Margin sustainability: Q1 2026 net income margin of 53.4% is unusually high relative to prior Q1 margins (Q1 2025: 24.2%; Q1 2024: 16.7%). If this margin was boosted by one-time items or low-cost contract mix, a reversal in Q2 2026 could compress net income growth despite revenue gains.
The Moat
Palantir possesses genuine competitive advantages that we believe are durable but not yet fully battle-tested across a full economic cycle. Its moat rests on two pillars: installed-base stickiness and government incumbency.
The first pillar is the Ontology — the semantic layer that maps a customer’s data, logic, and actions into shared infrastructure. Once an enterprise or government agency builds its workflows on top of Palantir’s platforms, the switching cost is immense; it means rebuilding the central nervous system of the organization. The 10-K describes Foundry becoming “a central operating system not only for individual institutions
Persona Deliberations
Each persona has now read the full draft thesis above and written a structured critique — what they agree with, what they push back on, and their bottom line. This is where each takes their stand.
Warren Buffett — Reading the Thesis
What I agree with
The thesis correctly identifies the central truth: this is a genuine business with a broken stock price. The numbers are clear—operating margins have marched from –107% to +31.6%, and free cash flow hit $2.1 billion in FY2025. The DCF base case of $22.19 per share, against a $138 quote, yields a margin of safety of –522%, and the reverse-DCF model clips at +50%, meaning no reasonable assumptions can justify the current price. The treatment of stock-based compensation is blunt and honest: SBC has averaged 142% of reported free cash flow, and the share count has swollen by 135.8% over the period. Only in FY2025 did true FCF after SBC reach $1,417 million—a number that, for the first time, actually belongs to owners. The balance sheet fortress ($2.3 billion in cash, zero debt) is an unquestionable strength. The thesis gets all this right.
What I’d push back on
The moat discussion is heavy on narrative and light on quantitative proof. The claim that contract stickiness from the Ontology and government incumbency creates durable competitive advantage is plausible, but there is no historical ROIC consistency to support it—the data is missing, and the current-year ROIC of roughly 22% is a single observation from a boom year. A real moat should show margin durability through cycles, yet Palantir’s quarterly revenue just dropped 47% sequentially (Q3 2025 to Q1 2026) and Q1 2026 YoY revenue fell –19.9%, a 52.5-point gap to the 5-year CAGR. That volatility doesn’t look like a business with predictable, fortress-like repeat revenue; it looks like lumpy, concentrated contract timing. The working-capital deterioration—accounts receivable days doubling from 45 to 85, while accounts payable days collapsed from 81 to 4—contradicts the “indispensable partner” story. If customers can’t live without you, they pay faster, not slower. These signals suggest the moat is narrower than the thesis implies and hasn’t been tested in a downturn.
Management credibility should be a C, not a B. The $1.78 billion cash evaporation in FY2023, against $697 million of reported FCF, went entirely unexplained in the MD&A. That is a significant withdrawal. The earlier prominent use of “adjusted income from operations excluding SBC”—while the share count was ballooning—was misleading, and dropping the metric without acknowledgment reads as a quiet retreat, not a correction. A management team that dilutes owners by 136% and never repurchases a single share doesn’t merit a B. The operational underpromise-and-overdeliver pattern is a plus, but capital allocation and transparency are at least a letter grade lower.
I’d reverse my view if the business demonstrates sustained per-share free cash flow growth (after full SBC subtraction) for four straight quarters, and accounts receivable days stabilize below 60, indicating that the cash conversion is real and the moat is translating into better payment terms—not just headline growth.
My bottom line
PASS. Palantir is an excellent, capital-light software business with real operating leverage and an AI tailwind, but at $138 the stock is a speculation, not an investment. The per-share economics have been so thoroughly diluted that even a 30% margin doesn’t flow to shareholders in proportion; I’d only consider it if the price fell to a level where the reverse-DCF implied growth drops below 15%—which would be a fraction of today’s quote. For now, it stays on the watchlist.
Seth Klarman — Reading the Thesis
What I agree with
The thesis correctly identifies the single most critical risk: per-share value has been systematically confiscated by stock-based compensation. Cumulative dilution of +135.8% and SBC averaging 142% of reported FCF over the period mean that even the FY2025 “true FCF after SBC” of $1,417M is still far smaller than the headline $2,101M suggests. The accounts-receivable deterioration — from 45 days in 2021 to 85 days in 2025 — is a tangible sign that bargaining power is weakening, not strengthening, and the unexplained $1.78B cash evaporation in FY2023 while FCF printed $697M is a red flag management has never reconciled. I also agree with the conclusion that the reverse-DCF clips at +50% implied growth; a stock that requires perpetual growth beyond what any reasonable model can solve for is, by definition, not an investment. The Pass verdict is the only intellectually defensible conclusion.
What I’d push back on
The thesis still calls Palantir a “wonderful business,” but that is a description of the enterprise, not of the stock. For an owner, a business that consistently transfers wealth to employees and customers while rewarding shareholders only with hope is not wonderful. The 0.45% free-cash-flow yield (true FCF after SBC divided by the $317B market cap) is well below the 4.57% 10-year Treasury — the market is paying for a story, not for cash. Even the thesis’s own stress tests produce an intrinsic value of $6.99 in a recession scenario, which is not “armageddon” — it is what happens when a company dependent on a handful of large, terminable contracts faces a demand slowdown. The quarterly data confirm this fragility: Q3 2025 revenue was $3.07B, Q1 2026 was $1.63B; a single large-deal delay can halve quarterly revenue. A specific downside scenario for this business is not a credit-cycle bank replay, but a simple AI-adoption fatigue cycle where commercial customers cut non-mission-critical spend and government procurement tightens. In that world, revenue could easily decline 20-30%, the fixed-cost structure would flip operating margins back to negative, and the shares — already valued for infinite growth — would fall far below the DCF bear case, possibly into single digits. The margin of safety at the current price is not just negative; it is a ‑522% chasm. Any analysis that frames this as “a wonderful business with a terrible stock price” underestimates how quickly the business itself could become terrible under stress.
I’d reverse my view if Palantir’s actual revenue conversion from remaining deal value sustainably exceeds 50% (versus the historical pattern of substantial non-realization) and the stock collapses to below $25, providing at least a 30% margin of safety against the base-case IV of $22.19. Until then, no number of bootcamps or booted-up deal values changes the arithmetic.
My bottom line
AVOID — permanent capital loss risk is extreme. The current price of $138.08 embeds expectations that require >50% growth forever; the margin of safety is ‑522% (price is 6.2× intrinsic value). Even the most generous bull case yields $24.01, and the true per-share cash claim after dilution is a fraction of that. Any setback — a terminated government contract, a missed large deal — could wipe out 80% or more of the stock’s value. There is no investable opportunity here.
Chris Hohn (TCI) — Reading the Thesis
What I agree with
The thesis correctly identifies that Palantir’s Ontology creates genuine switching costs—once a customer’s workflows are built on Foundry/Gotham, extraction is painful. The FY2025 unit economics are undeniably strong: 31.6% operating margin, $2.1B headline FCF on an asset‑light, debt‑free balance sheet. But the critical insight is the valuation disconnect. The reverse‑DCF clips at +50%, meaning the market implies perpetual growth no framework can accommodate; even the bull‑case DCF is $24.01, offering a –522% margin of safety at $138.08. That alone makes this stock untouchable regardless of business quality. The thesis also correctly flags the dilution: SBC averaging 142% of reported FCF, cumulative share count +135.8%, and the AR‑days stretch from 45 to 85 days—a signal that bargaining power is eroding, not strengthening.
What I’d push back on
The moat is unproven on a 30‑year horizon. High switching costs do not automatically mean a durable franchise—Moody’s essential recurring revenue is not the same as a SaaS subscription you can cancel with effort. Palantir’s government contracts have termination‑for‑convenience clauses; the conversion of $11.2B remaining deal value to revenue is unguaranteed, and the MD&A itself warns historically not all of it materializes. The 10‑year ROIC data is absent, so we can’t separate structural returns from a cyclical AI‑wave upswing. The 31.6% margin may be inflated by one‑time large deals (Q3 2025 was $3.07B, Q1 2026 was $1.63B). Moreover, the capital allocation is shareholder‑hostile: management never bought back a single share while dilution ran +136%, and the FY2023 cash evaporation of $1.78B remains unexplained. That’s not an “A‑or‑B” management—it’s a team treating equity as a costless currency, eroding per‑share value. The thesis’s C grade is too generous for a business I’d hold 8+ years. I’d reverse my view if the company reduces net share count organically (buybacks exceeding new issuance) for three consecutive years and FCF after SBC per share grows at >15% annually over the same period—proving the dilution culture has ended and the moat actually serves shareholders.
My bottom line
PASS. The moat is plausible but not exceptional enough to survive multiple cycles, and the astronomical price already discounts a utopia that even a 30%‑margin compounder can’t deliver. The persistent dilution and capital‑allocation red flags make this uninvestable for an 8‑year hold—no margin of safety, no true owner‑earnings growth, no conviction.
Jim Chanos — Reading the Thesis
What I agree with
The thesis correctly surfaces several forensic signals that would kill a weaker bull case. The reverse‑DCF clipping at +50%—meaning no combination of reasonable assumptions justifies $138—is the single strongest overvaluation signal our own framework can produce. The DCF base case of $22.19 is not a conservative estimate; it’s a rational one. The cumulative share‑count dilution of +135.8% and SBC running at an average of 142% of reported FCF are devastating to per‑share economics. The thesis acknowledges that true free cash flow after SBC was deeply negative for years, reaching only $1.4B in FY2025. That’s a real number, and at a $317B market cap it yields 0.4%—a yield that cannot compound. The AR‑days trajectory (45 to 85 days) while AP days collapse to 4 days is a tell: an indispensable platform shouldn’t be bleeding working capital like this. The FY2023 cash evaporation of $1.78B, unreconciled, is a transparency failure that chips away at management’s “B” credibility grade.
What I’d push back on
The thesis is too soft on the short side because it still calls the business “wonderful” and rates it 7/10 quality, while the evidence points to a late‑cycle over‑earner that has front‑loaded demand. The 31.6% operating margin is a product of fixed costs on a revenue spike that is unlikely to repeat. The quarterly data already show a -19.9% YoY in Q1 2026, and even allowing for seasonality, the year‑on‑year growth rate swung 52.5pp below the 5‑year CAGR—that’s a warning that the 2025 surge may have been a one‑time air pocket. The thesis correctly notes that a $1B revenue shortfall would vaporize $316M of operating income; if growth decelerates to single digits in a normalising AI spending environment, the operating leverage flips violently, and the margin could compress to mid‑teens within two years. The market isn’t pricing any of that.
The biggest forensic underweight: the true free‑cash‑flow yield after dilution is already sub‑1%, yet the stock is discounting decades of 50%+ growth. The thesis acknowledges the reverse‑DCF clipping but then settles on a “Pass.” I’d argue that’s precisely the kind of disconnect where the short has an edge. The single most concrete reason this stock could be down 50% three years from now is a revenue‑growth deceleration to sub‑20% by FY2027, combined with margin compression toward 18%, causing a re‑rating from the current ~70x P/E on true diluted earnings to 25x. That would put the stock in the $50-60 range—a 60%+ decline. The catalyst is a series of quarterly revenue misses as AI bootcamp euphoria fades and government spending cycles tighten; the Q1 2026 print already hints at that fragility.
I’d reverse my view if Palantir delivers sustained 20%+ organic revenue growth and true FCF after SBC exceeds $2.5 billion annually by FY2027, with net share count flat, within the next six quarters. That would show the business can actually grow into a $300B+ valuation over a very long horizon.
My bottom line
SHORT_MODERATE—I’d short a small position or use puts. The forensic flags (dilution, working‑capital deterioration, cash opacity) and the reverse‑DCF clipping at +50% create a setup where the stock is priced for a growth trajectory even the company’s own seasonal patterns contradict. The margin of safety is negative 522%, and the potential for a growth‑miss‑driven re‑rating is high. I’d use puts to cap the upside tail risk from AI narrative momentum.
Persona Rebuttals
Each persona has now read the other three's Phase 4.5 critiques and writes a focused rebuttal. This is where they engage with each other's reasoning, identify the strongest counter-arguments, and state whether any of them have changed their mind.
Warren Buffett — Rebuttal
Where the others sharpened my view
Klarman made me think harder about how fast the business itself could turn. He wrote: “In that world, revenue could easily decline 20-30%, the fixed-cost structure would flip operating margins back to negative.” I had flagged the Q1 2026 revenue drop of 47% sequentially, but I hadn’t connected it to the fixed-cost leverage that could send margins back toward zero in a single year. The current 31.6% margin rests on a $13 billion revenue base that the quarterly numbers show can shrink by half in six months. A realistic AI-fatigue cycle that pulls revenue down 25%—say to $10 billion—would, on the current cost base, wipe out nearly all operating income. That means the “excellent business” I described could quickly produce losses, not just a lower stock price. Klarman’s point that the “margin of safety is -.522%” understates the danger: the business’s intrinsic value could fall further than the DCF base case of $22, if earnings collapse. That sharpened my view: the fragility is genuine, and passing isn’t just about price; it’s about what the business might earn in a normal year.
Where I push back on the others
Klarman and Chanos both argue that AVOID or SHORT_MODERATE are the right actions. I disagree. Chanos says the stock could fall to $50-60, a 60%+ decline, and I don’t dispute that as a plausible downside. But shorting a business with $2.3 billion in net cash, zero debt, and government incumbency in sensitive defense areas is not my game. Even in a sharp revenue fall, that cash pile—around $7.26 per share—puts a hard floor under the stock. Furthermore, the Ontology lock-in for existing customers means churn is unlikely to be catastrophic; revenue may drop, but the company won’t vanish. The narrative-driven market can also reward a single large contract win or a bootcamp conversion, causing violent rallies that squeeze shorts. Klarman’s AVOID is a safer stance, but it’s still a binary judgment I can’t fully endorse. The stock is objectively overvalued, so buying is foolish. But the existence of a substantial cash reserve and a real, differentiated product means it isn’t a business destined for bankruptcy. At a price below $25, the math flips—the reverse-DCF growth requirement drops into the achievable 10-12% range, and the margin of safety appears. So PASS—watchlist—remains the only sensible conclusion. I don’t need to short it, and I don’t need to warn of permanent loss with the same urgency, because the cash and product give the shares a genuine, if far-off, floor.
Has my bottom line changed?
No change—PASS. Klarman’s argument about margin fragility reinforces that the business is not yet a Buffett-style certainty, but it doesn’t change the fact that at some price it could be. The others’ analyses sharpen the bear case but don’t introduce a new fact that makes Palantir uninvestable at any price. It stays on the watchlist.
Seth Klarman — Rebuttal
Where the others sharpened my view
Chanos’ concrete re-rating scenario adds a specificity my own downside framework lacked. He quantifies the path to a 60%+ decline: “a revenue‑growth deceleration to sub‑20% by FY2027, combined with margin compression toward 18%, causing a re‑rating from the current ~70x P/E on true diluted earnings to 25x. That would put the stock in the $50‑60 range.” This aligns with my AI‑adoption fatigue scenario, but his arithmetic makes the margin-of-safety deficit even starker. Even $50—a 64% drop from $138—would still leave the stock at more than 2× my base‑case intrinsic value of $22.19. The 70x multiple he cites is on true diluted earnings; re‑rating to 25x would still imply a P/E that I would only pay for a business with demonstrated per‑share cash flow durability—a quality Palantir has never shown. Chanos also highlights the fragility of the quarterly growth rate, which swung 52.5pp below the 5‑year CAGR. That deepens my conviction that the 2025 margin peak is a one‑time harvest of fixed‑cost leverage, not a steady state. His forensic lens reinforces my view that the business is not “wonderful” but a late‑cycle over‑earner.
Where I push back on the others
Buffett’s framing as “an excellent, capital‑light software business” is the precise quality‑over‑price trap that destroys capital when margin of safety is ignored. At $138, the true FCF after SBC is $1,417M, a 0.45% yield on the $317B market cap. That is ‑522% of safety—no moat, no operating leverage, no AI tailwind
Chris Hohn (TCI) — Rebuttal
Where the others sharpened my view
Buffett’s demand for four straight quarters of per-share free cash flow growth after full SBC subtraction—and AR days stabilizing below 60—refines the proof standard I need. In my initial critique, I set a three-year buyback-plus-FCF-per-share growth bar, but Buffett’s shorter-term guardrails provide an early-warning filter: if Palantir can’t convert its headline margin into quality-of-earnings proof quickly, the moat isn’t strengthening. Klarman’s cold math on the 0.45% true FCF yield against a 4.57% risk-free rate drives home that the stock’s cash claim is near-zero even after the inflection—my “investable when dilution ends” condition is insufficient if the cash return remains trivial. Chanos’s forensic catch—the Q1 2026 YoY revenue decline of –19.9% paired with a 52.5-point gap to the 5-year CAGR—forces me to view the Ontology’s stickiness as yet untested in a downturn; a structural barrier should not generate that degree of quarterly volatility. These sharpen my conviction that moat metrics must be observed across a full cycle, not a single boom year.
Where I push back on the others
Chanos labels Palantir a “late-cycle over-earner” and recommends a short. That is plausible trading logic, but it doesn’t overturn my structural-barrier non-negotiable: I cannot short a business with a plausible, non-replicable Ontology, even if it’s grotesquely mispriced—narrative momentum can keep a stock irrational longer than shorts can stay solvent. My PASS isn’t a short; it’s a refusal to own a business where the ROIC history is missing and per-share dilution has destroyed any compounding. Klarman calls this “AVOID—permanent capital loss risk is extreme.” I’d counter: the underlying enterprise could still be “wonderful” at a fraction of the price, but the current quote and unproven per-share economics make it uninvestable today. That’s a PASS, not an AVOID—the distinction matters for a concentrated portfolio that needs to own great businesses, not merely avoid terrible ones. Buffett’s C grade for management is too generous: undisciplined capital allocation with zero buybacks over five years while the float balloons is a structural red flag, not a maturity phase. I push back on his willingness to accept a “B” if operational promises are met; for a 30-year hold, capital-allocation DNA is paramount. Until management shows owner-orientation with buybacks and transparency, that’s a disqualifier regardless of margin.
Has my bottom line changed?
Bottom line: PASS—unchanged. The rebuttals from all three personas reinforce the core problem: the moat is unproven, the price discounts infinity, and the per-share cash claim is microscopic. No argument presented moved the needle toward ACCUMULATE, because none can prove the Ontology creates a 30-year unbreachable structural barrier. I would only shift to ACCUMULATE if I see five consecutive years of accelerating moat metrics: (1) organic revenue growth sustains above 15% through at least one macro downturn, (2) ROIC (including all SBC as expense) exceeds 20% every year without the aid of one-time surges, (3) the net share count decreases for three consecutive years, proving the dilution culture is dead, and (4) AR days revert to the 2019 level of ~45, signaling pricing power that forces customers to pay on time. Any price decline below $25 alone does not meet that bar—valuation is a byproduct of moat proof, not a catalyst.
Jim Chanos — Rebuttal
Where the others sharpened my view
Klarman’s pushback crystallizes a scenario I had only gestured at: a simple AI‑adoption fatigue cycle where commercial spend collapses and government procurement tightens, flipping Palantir’s fixed‑cost operating leverage viciously. The thesis already flagged the –19.9% Q1 2026 YoY revenue decline, but Klarman connects that fragility to a potential margin collapse — mid‑teens or worse — within a normal cyclical contraction. That reframes my short not as a mere multiple‑compression bet, but as an anticipated earnings‑power reset, which is the most lethal kind of short. Hohn’s observation that government contracts carry termination‑for‑convenience clauses also sharpens the counterparty risk: the $11.2B remaining deal value is a wish list, not a backlog. These are not new facts, but they sharpen my conviction that the business is being priced as a secular compounder when its cash flows are breathtakingly lumpy and revocable.
Where I push back on the others
Buffett calls Palantir “an excellent, capital‑light software business with real operating leverage.” I’d counter that the operating leverage is symmetrical — and the forensic evidence says the business is already leaking. Accounts‑receivable days doubling from 45 to 85 while payables collapsed to 4 days is not the signature of an indispensable platform; it’s the signature of a vendor granting increasingly generous terms to close deals. That is working‑capital aggression, not pricing power. If the moat were as deep as the bull case claims, customers would prepay or accept tighter terms, not stretch payments to the breaking point. Meanwhile, the cumulative 135.8% share‑count dilution means the “operating leverage” has accrued overwhelmingly to employees, not shareholders. True per‑share FCF after SBC was a 0.45% yield in FY2025 — a rounding error on a $317B market cap. An excellent business that systematically fails to convert enterprise growth into per‑share owner earnings is excellent for everyone except the equity holder. The moat is unproven through a cycle, and the cash conversion indicators already show strain. That is not a wonderful business — it’s a wonderful stock for insiders.
Has my short conviction changed?
SHORT_MODERATE conviction unchanged. The other personas’ critiques surfaced no new bull evidence that weakens the short; if anything, Klarman’s explicit fatigue‑cycle scenario and Hohn’s contract‑cancellation risk strengthen the bear case. I remain convinced that a growth deceleration to sub‑20% by FY2027, combined with margin compression toward 18%, will force a re‑rating from 70x true diluted earnings to 25x, driving the stock into the $50–60 range. The catalyst is a series of quarterly revenue misses as AI bootcamp euphoria fades. I would close the short only if Palantir delivers two consecutive quarters of >20% organic revenue growth with stable AR days below 60 and net share count flat — signaling that the enterprise can actually compound per‑share value at a rate that justifies even a fraction of the current valuation.
Catalysts to watch
Specific upcoming events that could change this thesis. When the date arrives, re-run the analysis to surface what moved.
| Date | Title | Tests | Category |
|---|---|---|---|
| Q2 2026 | Q2 2026 earnings release | Revenue growth and operating margin kill criteria | earnings |
| Q3 2026 | Q3 2026 earnings release | Revenue growth trajectory and backlog conversion rate | earnings |
| Q4 2026 | Q4 2026 earnings release | Full-year revenue growth, operating margin, and true FCF after SBC | earnings |
| Q1 2027 | Q1 2027 earnings release | Revenue growth vs. 5-year CAGR of 32.6% | earnings |
| Q2 2027 | Q2 2027 earnings release | All thesis inputs: revenue growth, margins, SBC dilution, AR days | earnings |
Detail
- Q2 2026 earnings release (Q2 2026) — First quarter after the -19.9% YoY Q1 2026 print; tests whether revenue deceleration is structural or seasonal, and whether margins can sustain at or above 30%.
- Source:
[pc]
- Source:
- Q3 2026 earnings release (Q3 2026) — Historically the strongest quarter (Q3 2025 revenue $3.07B). A miss vs. elevated expectations would confirm demand fading; a beat would support the re-acceleration narrative.
- Source:
[quarterly]
- Source:
- Q4 2026 earnings release (Q4 2026) — Closes FY2026; provides full-year revenue and FCF figures. Tests whether the 2025 margin expansion was sustainable or one-time.
- Source:
[pc]
- Source:
- Q1 2027 earnings release (Q1 2027) — First quarterly report within 18-month horizon; compares to Q1 2026 base of $1.63B. Tests if growth can re-accelerate after seasonally weak Q1.
- Source:
[pc]
- Source:
- Q2 2027 earnings release (Q2 2027) — Final quarter within 18-month window; cumulative evidence of trend. Critical for assessing whether the stock's premium multiple is justified.
- Source:
[10k-mda-2026-p1]
- Source:
Conditional Buy Thesis
The verdict is Pass / Avoid today — but every Pass is a watchlist candidate. Below: what price + what events would flip this to a Buy.
What price would change my mind?
If Palantir’s stock fell below $12.70 per share — a 90.8% decline from the current $138.08 — it would offer a 30% margin of safety below the bear-case intrinsic value of $18.15. That is the price at which the reverse‑DCF implied growth requirement would drop from the unachievable +50% cap into a realistic single‑digit range, and the true free‑cash‑flow yield after stock‑based compensation would begin to approach the risk‑free rate. Absent this catastrophic repricing, the arithmetic remains irredeemable.
What observable events would change my mind?
Even at the right price, the bear case only weakens if per‑share owner economics demonstrably improve. I need a cluster of these specific, falsifiable signals:
- Net share count flat or declining for two consecutive quarters. The 135.8% cumulative dilution is the thesis’s central flaw; a sustained halt would prove management has finally aligned with shareholders.
- Accounts receivable days fall below 60 for two consecutive quarters. The current 85‑day stretch signals deteriorating bargaining power; a reversal to pre‑2021 levels would indicate the Ontology is actually forcing customers to pay faster.
- True free cash flow after SBC per share grows >15% year‑over‑year for two consecutive quarters. This directly tests whether the headline margin boom translates into genuine per‑share compounding, not just dilution‑masked gains.
- Revenue growth sustains above 20% YoY for two consecutive quarters with no single quarter’s sequential drop exceeding 30%. This would confirm the Q1 2026 –19.9% YoY was seasonal noise, not the start of a growth cliff.
- Remaining deal value conversion rate exceeds 60% over trailing four quarters. The 10‑K warns that historically “not all” of the $11.2B backlog converts to revenue; a step‑change in realized conversion would validate that the backlog is genuine, not a hope chest.
My bottom line
I would flip to BUY only if both conditions are met: the stock trades below $12.70, and at least three of the five events above have material
What each investor would say
Four lenses on the same business.
Chanos
The Bear · high short convictionWhat I agree with
The thesis correctly surfaces several forensic signals that would kill a weaker bull case. The reverse‑DCF clipping at +50%—meaning no combination of reasonable assumptions justifies $138—is the single strongest overvaluation signal our own framework can produce. The DCF base case of $22.19 is not a conservative estimate; it’s a rational one. The cumulative share‑count dilution of +135.8% and SBC running at an average of 142% of reported FCF are devastating to per‑share economics. The thesis acknowledges that true free cash flow after SBC was deeply negative for years, reaching only $1.4B in FY2025. That’s a real number, and at a $317B market cap it yields 0.4%—a yield that cannot compound. The AR‑days trajectory (45 to 85 days) while AP days collapse to 4 days is a tell: an indispensable platform shouldn’t be bleeding working capital like this. The FY2023 cash evaporation of $1.78B, unreconciled, is a transparency failure that chips away at management’s “B” credibility grade.
What I’d push back on
The thesis is too soft on the short side because it still calls the business “wonderful” and rates it 7/10 quality, while the evidence points to a late‑cycle over‑earner that has front‑loaded demand. The 31.6% operating margin is a product of fixed costs on a revenue spike that is unlikely to repeat. The quarterly data already show a -19.9% YoY in Q1 2026, and even allowing for seasonality, the year‑on‑year growth rate swung 52.5pp below the 5‑year CAGR—that’s a warning that the 2025 surge may have been a one‑time air pocket. The thesis correctly notes that a $1B revenue shortfall would vaporize $316M of operating income; if growth decelerates to single digits in a normalising AI spending environment, the operating leverage flips violently, and the margin could compress to mid‑teens within two years. The market isn’t pricing any of that.
The biggest forensic underweight: the true free‑cash‑flow yield after dilution is already sub‑1%, yet the stock is discounting decades of 50%+ growth. The thesis acknowledges the reverse‑DCF clipping but then settles on a “Pass.” I’d argue that’s precisely the kind of disconnect where the short has an edge. The single most concrete reason this stock could be down 50% three years from now is a revenue‑growth deceleration to sub‑20% by FY2027, combined with margin compression toward 18%, causing a re‑rating from the current ~70x P/E on true diluted earnings to 25x. That would put the stock in the $50-60 range—a 60%+ decline. The catalyst is a series of quarterly revenue misses as AI bootcamp euphoria fades and government spending cycles tighten; the Q1 2026 print already hints at that fragility.
I’d reverse my view if Palantir delivers sustained 20%+ organic revenue growth and true FCF after SBC exceeds $2.5 billion annually by FY2027, with net share count flat, within the next six quarters. That would show the business can actually grow into a $300B+ valuation over a very long horizon.
My bottom line
SHORT_MODERATE—I’d short a small position or use puts. The forensic flags (dilution, working‑capital deterioration, cash opacity) and the reverse‑DCF clipping at +50% create a setup where the stock is priced for a growth trajectory even the company’s own seasonal patterns contradict. The margin of safety is negative 522%, and the potential for a growth‑miss‑driven re‑rating is high. I’d use puts to cap the upside tail risk from AI narrative momentum.
Buffett
What I agree with
The thesis correctly identifies the central truth: this is a genuine business with a broken stock price. The numbers are clear—operating margins have marched from –107% to +31.6%, and free cash flow hit $2.1 billion in FY2025. The DCF base case of $22.19 per share, against a $138 quote, yields a margin of safety of –522%, and the reverse-DCF model clips at +50%, meaning no reasonable assumptions can justify the current price. The treatment of stock-based compensation is blunt and honest: SBC has averaged 142% of reported free cash flow, and the share count has swollen by 135.8% over the period. Only in FY2025 did true FCF after SBC reach $1,417 million—a number that, for the first time, actually belongs to owners. The balance sheet fortress ($2.3 billion in cash, zero debt) is an unquestionable strength. The thesis gets all this right.
What I’d push back on
The moat discussion is heavy on narrative and light on quantitative proof. The claim that contract stickiness from the Ontology and government incumbency creates durable competitive advantage is plausible, but there is no historical ROIC consistency to support it—the data is missing, and the current-year ROIC of roughly 22% is a single observation from a boom year. A real moat should show margin durability through cycles, yet Palantir’s quarterly revenue just dropped 47% sequentially (Q3 2025 to Q1 2026) and Q1 2026 YoY revenue fell –19.9%, a 52.5-point gap to the 5-year CAGR. That volatility doesn’t look like a business with predictable, fortress-like repeat revenue; it looks like lumpy, concentrated contract timing. The working-capital deterioration—accounts receivable days doubling from 45 to 85, while accounts payable days collapsed from 81 to 4—contradicts the “indispensable partner” story. If customers can’t live without you, they pay faster, not slower. These signals suggest the moat is narrower than the thesis implies and hasn’t been tested in a downturn.
Management credibility should be a C, not a B. The $1.78 billion cash evaporation in FY2023, against $697 million of reported FCF, went entirely unexplained in the MD&A. That is a significant withdrawal. The earlier prominent use of “adjusted income from operations excluding SBC”—while the share count was ballooning—was misleading, and dropping the metric without acknowledgment reads as a quiet retreat, not a correction. A management team that dilutes owners by 136% and never repurchases a single share doesn’t merit a B. The operational underpromise-and-overdeliver pattern is a plus, but capital allocation and transparency are at least a letter grade lower.
I’d reverse my view if the business demonstrates sustained per-share free cash flow growth (after full SBC subtraction) for four straight quarters, and accounts receivable days stabilize below 60, indicating that the cash conversion is real and the moat is translating into better payment terms—not just headline growth.
My bottom line
PASS. Palantir is an excellent, capital-light software business with real operating leverage and an AI tailwind, but at $138 the stock is a speculation, not an investment. The per-share economics have been so thoroughly diluted that even a 30% margin doesn’t flow to shareholders in proportion; I’d only consider it if the price fell to a level where the reverse-DCF implied growth drops below 15%—which would be a fraction of today’s quote. For now, it stays on the watchlist.
Hohn
What I agree with
The thesis correctly identifies that Palantir’s Ontology creates genuine switching costs—once a customer’s workflows are built on Foundry/Gotham, extraction is painful. The FY2025 unit economics are undeniably strong: 31.6% operating margin, $2.1B headline FCF on an asset‑light, debt‑free balance sheet. But the critical insight is the valuation disconnect. The reverse‑DCF clips at +50%, meaning the market implies perpetual growth no framework can accommodate; even the bull‑case DCF is $24.01, offering a –522% margin of safety at $138.08. That alone makes this stock untouchable regardless of business quality. The thesis also correctly flags the dilution: SBC averaging 142% of reported FCF, cumulative share count +135.8%, and the AR‑days stretch from 45 to 85 days—a signal that bargaining power is eroding, not strengthening.
What I’d push back on
The moat is unproven on a 30‑year horizon. High switching costs do not automatically mean a durable franchise—Moody’s essential recurring revenue is not the same as a SaaS subscription you can cancel with effort. Palantir’s government contracts have termination‑for‑convenience clauses; the conversion of $11.2B remaining deal value to revenue is unguaranteed, and the MD&A itself warns historically not all of it materializes. The 10‑year ROIC data is absent, so we can’t separate structural returns from a cyclical AI‑wave upswing. The 31.6% margin may be inflated by one‑time large deals (Q3 2025 was $3.07B, Q1 2026 was $1.63B). Moreover, the capital allocation is shareholder‑hostile: management never bought back a single share while dilution ran +136%, and the FY2023 cash evaporation of $1.78B remains unexplained. That’s not an “A‑or‑B” management—it’s a team treating equity as a costless currency, eroding per‑share value. The thesis’s C grade is too generous for a business I’d hold 8+ years. I’d reverse my view if the company reduces net share count organically (buybacks exceeding new issuance) for three consecutive years and FCF after SBC per share grows at >15% annually over the same period—proving the dilution culture has ended and the moat actually serves shareholders.
My bottom line
PASS. The moat is plausible but not exceptional enough to survive multiple cycles, and the astronomical price already discounts a utopia that even a 30%‑margin compounder can’t deliver. The persistent dilution and capital‑allocation red flags make this uninvestable for an 8‑year hold—no margin of safety, no true owner‑earnings growth, no conviction.
Klarman
What I agree with
The thesis correctly identifies the single most critical risk: per-share value has been systematically confiscated by stock-based compensation. Cumulative dilution of +135.8% and SBC averaging 142% of reported FCF over the period mean that even the FY2025 “true FCF after SBC” of $1,417M is still far smaller than the headline $2,101M suggests. The accounts-receivable deterioration — from 45 days in 2021 to 85 days in 2025 — is a tangible sign that bargaining power is weakening, not strengthening, and the unexplained $1.78B cash evaporation in FY2023 while FCF printed $697M is a red flag management has never reconciled. I also agree with the conclusion that the reverse-DCF clips at +50% implied growth; a stock that requires perpetual growth beyond what any reasonable model can solve for is, by definition, not an investment. The Pass verdict is the only intellectually defensible conclusion.
What I’d push back on
The thesis still calls Palantir a “wonderful business,” but that is a description of the enterprise, not of the stock. For an owner, a business that consistently transfers wealth to employees and customers while rewarding shareholders only with hope is not wonderful. The 0.45% free-cash-flow yield (true FCF after SBC divided by the $317B market cap) is well below the 4.57% 10-year Treasury — the market is paying for a story, not for cash. Even the thesis’s own stress tests produce an intrinsic value of $6.99 in a recession scenario, which is not “armageddon” — it is what happens when a company dependent on a handful of large, terminable contracts faces a demand slowdown. The quarterly data confirm this fragility: Q3 2025 revenue was $3.07B, Q1 2026 was $1.63B; a single large-deal delay can halve quarterly revenue. A specific downside scenario for this business is not a credit-cycle bank replay, but a simple AI-adoption fatigue cycle where commercial customers cut non-mission-critical spend and government procurement tightens. In that world, revenue could easily decline 20-30%, the fixed-cost structure would flip operating margins back to negative, and the shares — already valued for infinite growth — would fall far below the DCF bear case, possibly into single digits. The margin of safety at the current price is not just negative; it is a ‑522% chasm. Any analysis that frames this as “a wonderful business with a terrible stock price” underestimates how quickly the business itself could become terrible under stress.
I’d reverse my view if Palantir’s actual revenue conversion from remaining deal value sustainably exceeds 50% (versus the historical pattern of substantial non-realization) and the stock collapses to below $25, providing at least a 30% margin of safety against the base-case IV of $22.19. Until then, no number of bootcamps or booted-up deal values changes the arithmetic.
My bottom line
AVOID — permanent capital loss risk is extreme. The current price of $138.08 embeds expectations that require >50% growth forever; the margin of safety is ‑522% (price is 6.2× intrinsic value). Even the most generous bull case yields $24.01, and the true per-share cash claim after dilution is a fraction of that. Any setback — a terminated government contract, a missed large deal — could wipe out 80% or more of the stock’s value. There is no investable opportunity here.
Kill criteria
If any of these triggers, the thesis is dead — exit, don't average down.
- Extreme overvaluation: negative 522% margin of safety
- Heavy dilution from SBC: shares outstanding up 136% since 2018
- Quarterly revenue lumpiness: Q1 2026 YoY growth -19.9% vs 5y CAGR 32.6%
- Government contract non-performance risk: termination for convenience
- Macro tightening could compress multiples for growth stocks
Macro calibration
Elevated Shiller CAPE (42) and tight credit spreads (HY OAS decile 1) suggest a speculative market environment; PLTR's valuation—6.2x base IV—is particularly vulnerable to any growth disappointment.
More sample theses
Browse the full sample library.
Now run your own.
Type a US ticker. Thirty minutes later, you receive the same kind of thesis we just showed you for PLTR — fact-checked, kill-criteria named, intrinsic value triangulated.
First thesis free · no card required